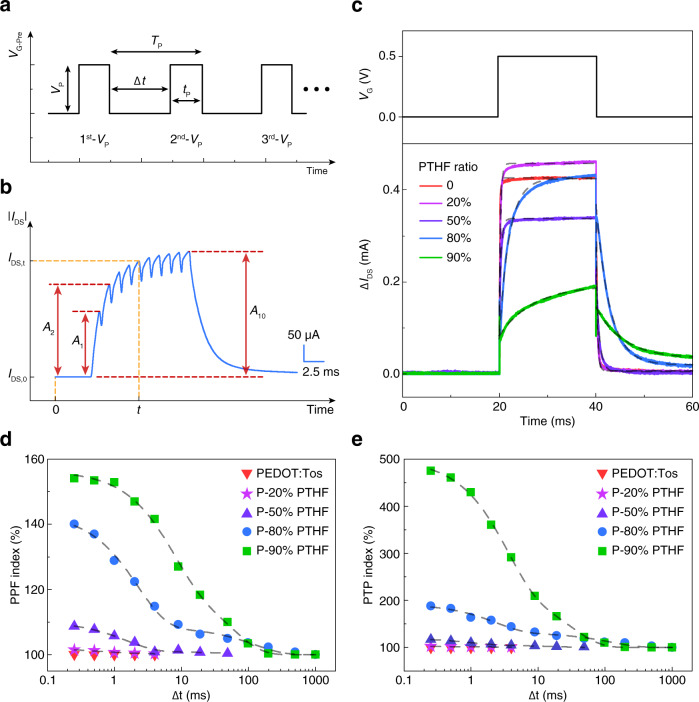
Fig. 2. Mimicking STP using an OECT artificial synapse.
a Patterns of pulsed gate voltage with different parameters; Vp: voltage amplitude, : pulsed voltage interval time, tp: pulsed voltage duration, Tp: pulsed voltage period. b Channel current modulation induced by 10 consecutive gate voltage pulses in the P-80% PTHF-based OECT. c Transient response of the PEDOT:Tos/PTHF-based OECT with different PTHF blend ratio. All the dashed lines are exponential decay fitting curves. The rise-time of the current pulse when the gate voltage was applied is defined as response time, while the decay-time of the current pulse after the gate voltage was removed is defined as ion relaxation time. The response time of devices with different PTHF blend ratio are . The ion relaxation time of devices with different PTHF blend ratio are . d, e Paired-pulse facilitation (PPF) and post-tetanic potentiation (PTP) indexes as a function of OECT channel composition and interval time of gate pulses, under tp of 1 ms. Gray dashed lines are the fitting curves.

