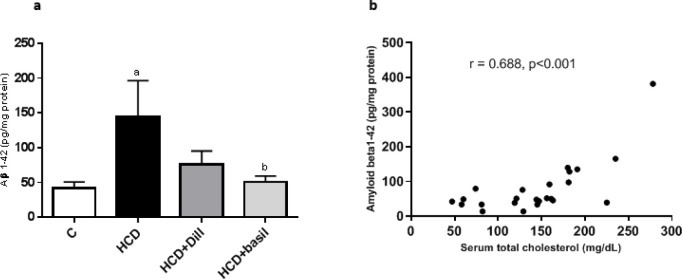
Figure 7.
(a) Hippocampus amyloid β(1-42) levels in different experimental groups. (b) Correlation between hippocampus Aβ(1-42) and serum total cholesterol, Pearson correlation coefficient= 0.688, r2=0.472, P<0.001. a represents P-value less than 0.01 against the control group and b shows a P-value less than 0.05 compared with the HCD group
HCD: high-cholesterol diet

