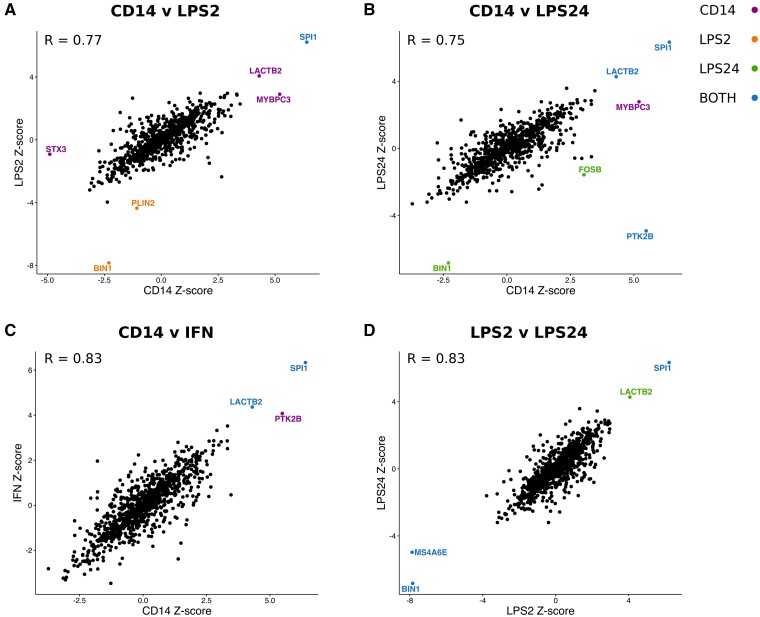
Figure 3.
Correlation plots of Z-scores from TWAS in monocytes. Genes are colour-coded according to their TWAS significance in cells each monocyte lineage: naïve CD14 = purple; LPS2-induced = orange; LPS24_induced = green or in both cell types (blue). The increase in expression of SPI1 associated with Alzheimer’s disease is present in all of the monocyte lineages and that of LACTB2 in naïve CD14, LPS24 induced and IFN induced cells. R denotes the Pearson correlation coefficient between the Z-scores in each case.

