FIGURE 2.

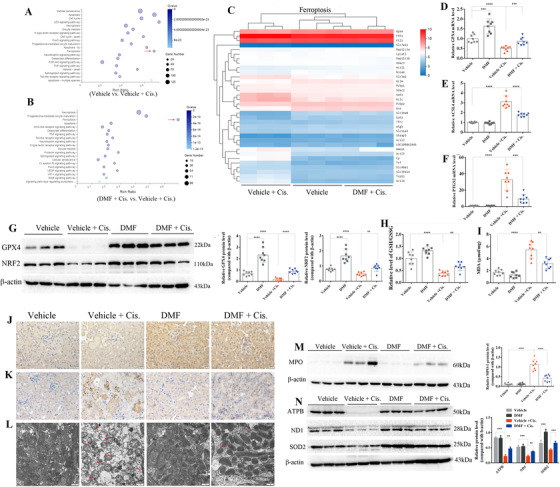
Dimethyl fumarate (DMF) treatment upregulated the nuclear translocation of NRF2 and attenuated cisplatin‐induced ferroptosis in vivo. The results of RNA‐seq analysis: (A) KEGG pathway classification and enrichment of differentially expressed genes in the vehicle versus vehicle + cisplatin groups revealed that cisplatin‐induced cell death in the kidney mainly included apoptosis, necroptosis, and ferroptosis (indicated by red arrow). (B) The results of the KEGG pathway enrichment analysis of differentially expressed genes of the cell death pathway showed that ferroptosis (indicated by red arrow), more than apoptosis and necroptosis, was the main differentially expressed pathway in the DMF + cisplatin versus vehicle + cisplatin groups. (C) Heat map of the KEGG pathway clustering of genes of the ferroptosis pathway in the vehicle, vehicle + cisplatin, and DMF + cisplatin groups. The results of qRT‐PCR showed that DMF treatment restored the mRNA levels of GPX4 (D) and decreased the mRNA levels of positive ferroptosis regulators, including ACSL4 (E) and PTGS2 (F), in the kidney of cisplatin‐treated mice. (G) The protein levels of GPX4 and NRF2 in the kidney in all groups were analyzed by Western blotting, and the quantified results are shown on the right. (H) The relative GSH/GSSG ratio (compared with the vehicle group) in the kidneys of mice treated with cisplatin (72 h) with or without DMF (10 mg/kg/day) administration. (I) Levels of MDA in the kidneys of all groups were measured by using a commercial kit. (J) Representative immunohistochemistry (IHC) staining of NRF2 in the kidneys of cisplatin‐treated mice with or without DMF treatment (magnification 400×; scale bar: 20 μm); the quantified results are shown in Figure S2A. (K) Representative IHC staining of 4‐HNE in the kidneys of all groups; the results were quantified by ImageJ and are shown in Figure S2B. (L) Representative transmission electron microscopy images of mitochondria in renal tubular cells of the renal cortex. Red arrow: damaged mitochondria (the quantified results of three mice in each group are shown in Figure S2C; cisplatin treatment for 72 h; scale bar: 1 μm). The protein levels of MPO (M), SOD2, ATPB, and ND1 (N) in the kidneys of mice were analyzed by Western blotting; the quantified results are shown on the right. The results are shown as the mean ± SD of eight mice in each group. ****p < .0001, ***p < .001, **p < .01, *p < .05 (analyzed by one‐way ANOVA)
