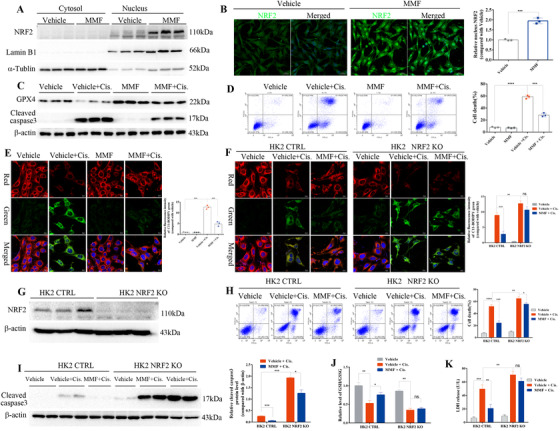
FIGURE 3.

Dimethyl fumarate (DMF) promoted the activation of Nrf2 and inhibited cisplatin‐induced ferroptosis in HK2 cells. (A) Expression and subcellular localization of NRF2 were measured in HK2 cells after treatment with 10 μM MMF for 24 h by Western blotting of cellular fractions and immunofluorescence (IF) staining; the quantified results are shown on the right (B). (C) Protein levels of GPX4 and cleaved caspase‐3 in HK2 cells challenged with cisplatin with or without MMF (10 μM) were analyzed by Western blotting; the quantified results are shown in Figure S3C. (D) The death of HK2 cells induced by cisplatin was analyzed by flow cytometry; the quantified results are shown on the right. (E) Lipid peroxides were detected by staining with the fluorescent lipophilic BODIPY 581/591 C11 sensor (green: oxidized lipids; red: lipids; and blue: Hoechst; scale bar: 10 μm) analyzed by confocal fluorescence microscopy. The cells were pretreated with MMF and cultured with cisplatin (10 μg/ml) for 24 h. The graph shows the quantification of mean fluorescence intensity (MFI) ± SD of three independent experiments. (F) Representative fluorescence images of BODIPY 581/591 C11 staining of NRF2 KO and control HK2 cells (green: oxidized lipids; red: lipids; blue: Hoechst; scale bar: 10 μm). MFI of C11 was analyzed by ImageJ, and the results are shown on the right. (G) Knockout of NRF2 by the CRISPR/Cas9 strategy in HK2 cells was confirmed by Western blotting analysis and the quantified results are shown in Figure S3G. (H) The death of NRF2 KO and control HK2 cells induced by cisplatin treatment with or without MMF (10 μM) was analyzed by flow cytometry, and the quantified results are shown on the right. (I) Protein levels of cleaved caspase‐3 in NRF2 KO and control HK2 cells challenged with cisplatin with or without MMF (10 μM) were analyzed by Western blotting, and the quantified results are shown on the right. (J) The relative GSH/GSSG ratio (compared with the vehicle group) was analyzed in HK2 cells treated with cisplatin (10 mg/ml) for 24 h with or without MMF (10 μM). (K) LDH release from NRF2 KO and control HK2 cells treated with cisplatin (10 μg/ml) for 24 h; the LDH concentration was assayed in the supernatants. Three independent experiments were performed. The data are expressed as the mean ± SD. MFI: mean fluorescence intensity; ****p < .0001, ***p < .001, **p < .01, *p < .05 (two‐way ANOVA)
