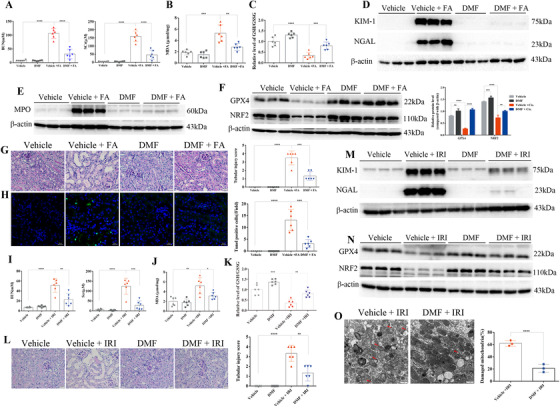
FIGURE 4.

Dimethyl fumarate (DMF) treatment protected against folic acid‐ and ischemia‐reperfusion‐induced acute kidney injury. (A) BUN and SCr of FA‐treated mice with or without DMF (10 mg/kg/day) administration (n = 6 mice of each group). (B) DMF (10 mg/kg/day) administration decreased the upregulated levels of MDA in the kidneys of FA‐treated mice. (C) The relative GSH/GSSG ratio (compared with the vehicle group) was determined in the kidneys of mice treated with FA (72 h) with or without DMF (10 mg/kg/day) administration. The protein levels of KIM‐1, NGAL (D), MPO (E), GPX4, and NRF2 (F) in the kidneys of FA‐treated mice with or without DMF administration were analyzed by immunoblotting, and the results of densitometry analysis performed by ImageJ are shown on the right; Figure S4A,B. (G) Representative PAS staining images (scale bar: 20 μm) of the kidneys in all groups. Tubular injury scores were analyzed (right). (H) Representative images of TUNEL staining revealed that DMF treatment protected against cell death induced by FA (scale bar: 20 μm; green: TUNEL; blue: DAPI); the number of TUNEL‐positive cells in five random fields from each kidney are shown on the right. (I) BUN and SCr of ischemia‐reperfusion injury (IRI) mice with or without DMF (10 mg/kg/day) administration (n = 6 mice in each group). (J) DMF (10 mg/kg/day) administration decreased the upregulated levels of MDA in the kidneys of IRI mice. (K) The relative GSH/GSSG ratio (compared with the vehicle group) was analyzed in the kidneys of IRI mice (24 h) with or without DMF (10 mg/kg/day) administration. (L) Representative PAS staining images (scale bar: 20 μm) of the kidneys in all groups. Tubular injury scores were analyzed (right). The protein levels of KIM‐1, NGAL (M), GPX4, and NRF2 (N) in the kidneys of IRI mice with or without DMF treatment were analyzed by immunoblotting, and the results of densitometry analysis performed by ImageJ are shown in Figure S4E,F. (O) Representative electron microscopy images and quantification of damaged mitochondria in renal tubular cells (the quantified results are shown as the mean ± SD of three mice in each group; IRI for 24 h; scale bar: 1 μm). The quantified results are shown as the mean ± SD of six mice in each group. ****p < .0001, ***p < .001, **p < .01, *p < .05 (one‐way ANOVA). FA, folic acid; IRI, ischemia‐reperfusion injury
