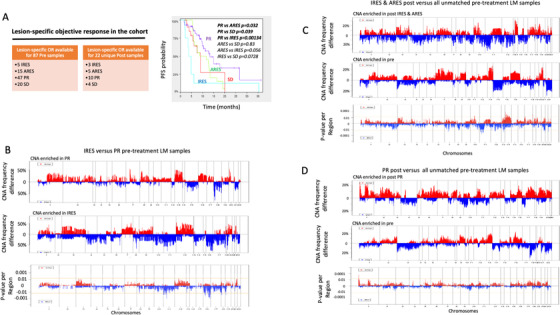
FIGURE 3.

Copy number variation association with lesion specific objective response. (A) Lesion‐specific ORs were available for a subset of pre‐ and post‐samples allowing subsequent group comparisons and Kaplan‐Meier curves of patient PFS by lesion‐specific ORs. (B) CNA frequency differences (CNA enriched in IRES on the top panel; CNA enriched in PR samples on the middle panel) or p values of the frequency differences (lower panel) between IRES and PR pre‐samples. (C) CNA frequency differences (CNA enriched in post resistant on the top panel; CNA enriched in pre‐samples on the middle panel) or p values of the frequency differences (lower panel) between post IRES and ARES samples versus all unmatched pre‐treatment samples. (D) CNA frequency differences (CNA enriched in post PR on the top panel; CNA enriched in pre‐samples on the middle panel) or p values of the frequency differences (lower panel) between post PR samples and all pre‐treatment samples. Horizontal yellow line represents the significance threshold (p < 0.005). In all graphs, vertical dotted lines represent chromosomes boundaries. OR: objective response; Pre: pre‐treatment, Post: post‐treatment; LM: liver metastasis; PT: primary tumor; PR: partial responder; ARES: acquired resistance; IRES: intrinsic resistance; SD: stable disease
