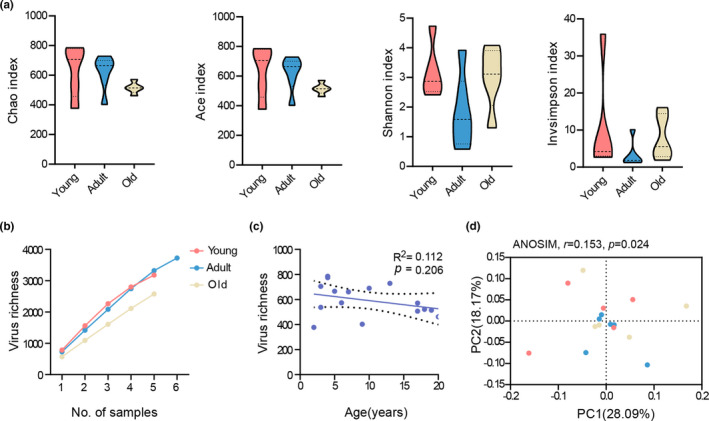
FIGURE 1.

The DNA virome biodiversity within the gut metagenome of cynomolgus macaques in the different age‐groups. (a) α‐diversity analysis showing the lack of statistically significant differences in viral richness (Chao and Ace index) and diversity (Invsimpson and Shannon index) among the three age groups. (b) Rarefaction curves showing the acquisition of viral species richness. (c) Viral species richness at the indicated ages. Linear regression, R 2 value, and 95% confidence intervals were shown. (d) Principal coordinate analysis (PCoA) based on the Abund–Jaccard distances showed a clear separation among the three age groups at the species level (ANOSIM, r = 0.153, p = 0.024). Young, n = 5; adult, n = 6; and old, n = 5
