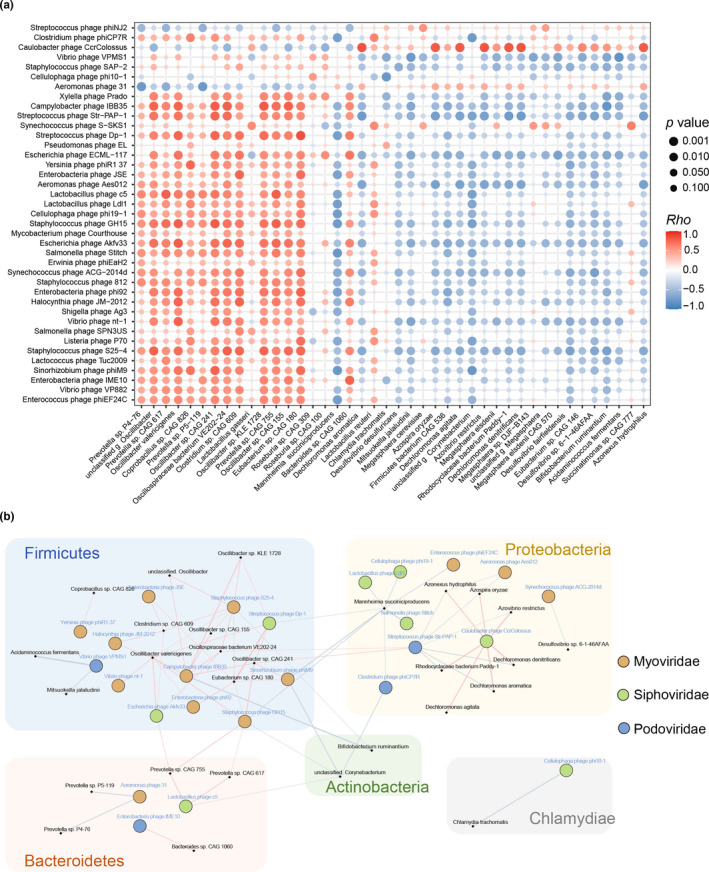
FIGURE 5.

Correlations between gut bacteriophages and bacteria. (a) Association between 39 different bacteriophages and 42 discriminative bacteria identified by LEfSe analysis of the metagenomic sequences (LDA > 2.0). The size and color of each scatter plot point showed the p values of Spearman's correlation (ranging from 9.87e–06 to 0.99) and correlation coefficient values (ranging from −0.867 to 0.874) between the different bacteriophages and bacteria, respectively. (b) Co‐occurrence network deduced from the relationship between the age‐related bacteriophages and bacteria. Circles and dots represented the different bacteriophages and bacteria, respectively. Circle colors varied according to the viral family. Bacterial species that were annotated at the phylum level were marked. Lines between nodes indicated Spearman's negative (light blue) or positive (light red) correlation, and line thickness indicated the p‐value (p < 0.001)
