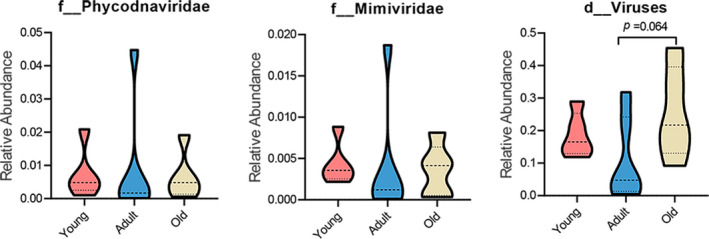
FIGURE A1.

Quantification of the relative abundance of the three unassigned families. No significant difference was found among the three agegroups. p values were determined by one‐way ANOVA followed by LSD’s multiple comparison tests. The following n values represented the number of independent animals for statistical evaluation: young, n = 5; adult, n = 6; and old, n = 5
