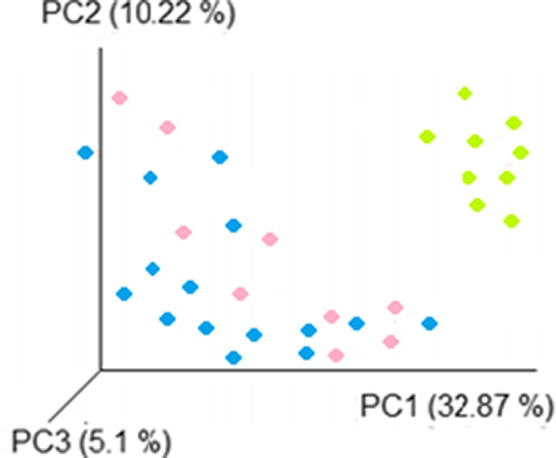
FIGURE 4.

Principal component analysis. The overall structure of the fecal microbiota was plotted according to the different clinical scenarios (active pancolitis [green], remission pancolitis [pink], and healthy participants [blue]). Each data point represents an individual sample
