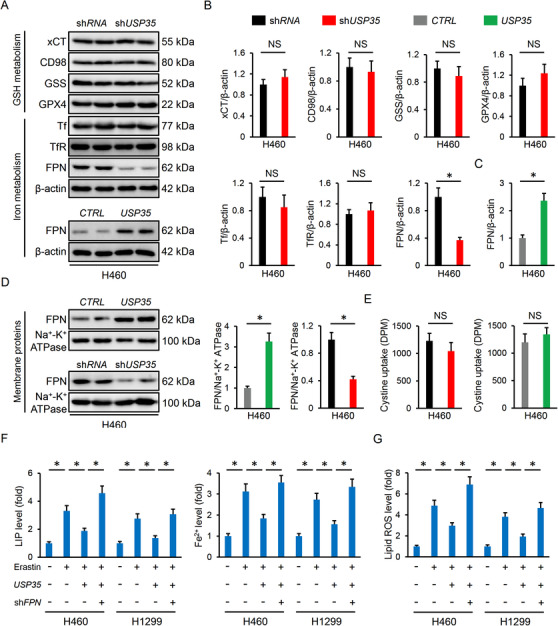
FIGURE 6.

USP35 modulates ferroptosis via targeting FPN. A‐D, Representative immunoblots and the quantitative data (n = 6). E, Cystine uptake levels (n = 6). F, Relative LIP and Fe2+ levels (n = 6). G, Lipid ROS generation (n = 6). Data are shown as mean ± SD, *P < .05 versus the matched group. NS indicates no significance
