
FIGURE 2.
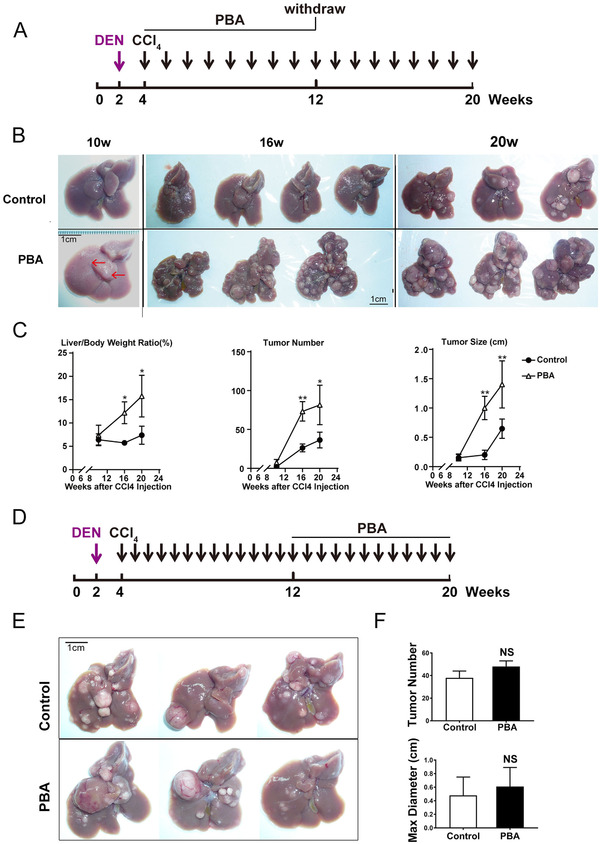
4‐PBA gave rise of HCC at early stage of tumor development. (A) Schematic experimental outline of 4‐PBA administration at early stage of tumor development. (B) Representative images of livers at 10 weeks, 16 weeks, and 20 weeks as indicated in 2A. Scale bar: 1 cm. (C) Liver/body weight ratio, tumor number, and tumor size were measured in PBA‐treated group and the control group at 16th week. *p < 0.05, **p < 0.01. (D) Schematic experimental outline of 4‐PBA administration at later stage of tumor development. (E) Representative images of livers at 20 weeks as indicated in 2D. Scale bar: 1 cm. (F) Tumor number and maximum diameter of tumors in 2E were measured in PBA‐treated group and the control group.