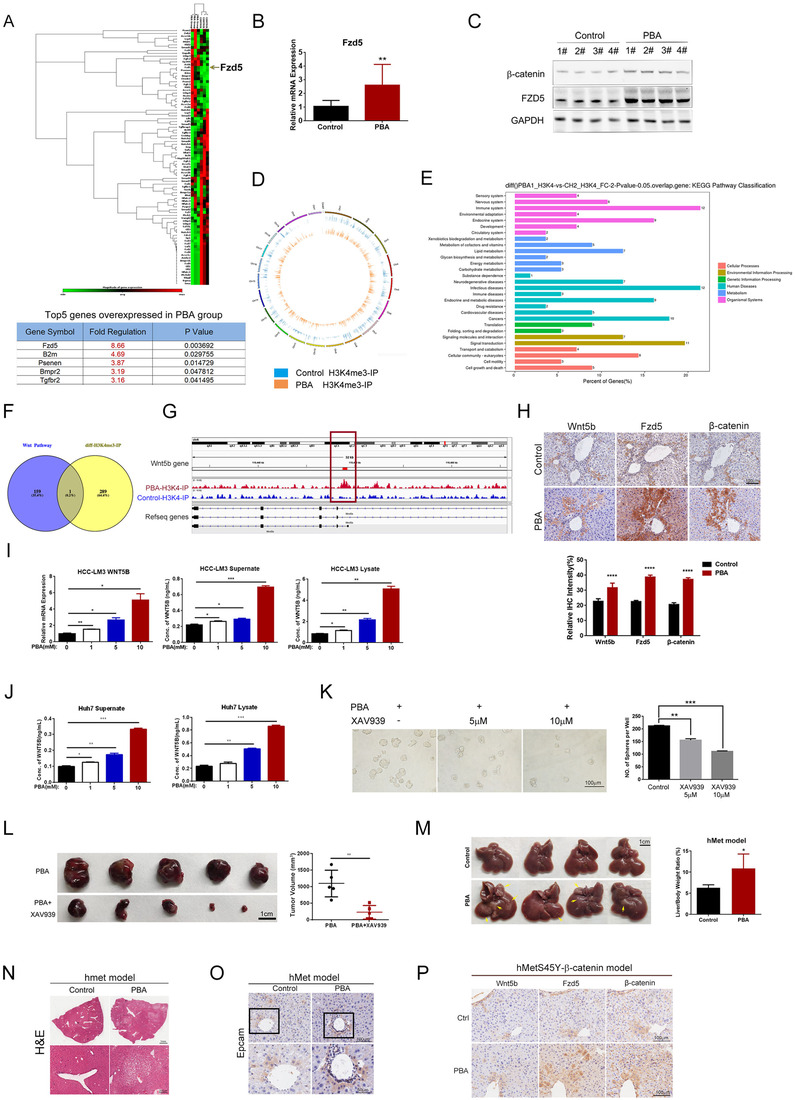
FIGURE 4.

4‐PBA regulated CSCs via activating Wnt5b‐Fzd5 mediating β‐catenin signaling pathway. (A) Heatmap of mouse stem cell signaling‐related genes determined by PCR array. Each group includes three samples. The arrow points at the expression of Fzd5, which is significantly increased in 4‐PBA treated group. The table represented top five overexpressed stem cell‐related genes in liver samples of DEN‐induced HCC model with 4‐PBA treated for 6 weeks compared with the control group. (B) Relative expression of Fzd5 in liver samples of DEN model with 4‐PBA supplemented for 6 weeks was determined by RT‐PCR. **p < 0.01. (C) The expression of β‐catenin and Fzd5 was detected by western blot. (D) CHIP‐seq was conducted in primarily separated hepatocyte from mice in DEN model treated with or without 4‐PBA for 6 weeks. H3K4me3 antibody was used as the binding protein. Gene distribution heat map of CHIP‐seq was presented. (E) KEGG pathway classification of the differential genes in CHIP‐seq was presented. (F) Wnt5b is the only overlapped gene of wnt pathway among varied genes detected in CHIP‐seq. (G) Wnt5b was detected as the differential gene among Wnt signaling‐related genes as the red square indicated. (H) Top: The expression of Wnt5b, Fzd5, and β‐catenin in serial section of liver in DEN model was detected by IHC. Scale bar: 100 μm. Down: The relative IHC intensity of Wnt5b, Fzd5, and β‐catenin. (I) MHCC‐LM3 was cultured in serum‐free medium supplemented with different doses of 4‐PBA (0, 1, 5, 10 mM) for 24 h. mRNA level of Wnt5b is determined by RT‐PCR. *p < 0.05, **p < 0.01. Wnt5b concentration in supernatant and cell lysate was measured by ELISA. (J) Huh7 was cultured in serum‐free medium supplemented with different doses of 4‐PBA (0, 1, 5, 10 mM) for 24 h. Wnt5b concentration in supernatant and cell lysate was measured by ELISA. (K) Huh7 was cultured in medium with PBA and different doses of XAV939 (0, 5, 10 μM) for 7 days. Representative photographs and the number of spheres formed in each group were presented. Scale bar: 200 μm. (L) Representative pictures of tumors in nude mice derived from Huh7 cells with or without XAV939 for 14 days. 4‐PBA was supplemented in drinking water. Tumor volume in each group was measured. Scale bar: 1 cm. (M) Representative photographs of livers in hMet model at the time point of 14 weeks. Yellow arrows point at visible tumors. Each liver/body weight was calculated and presented in the bar chart. (N) H&E staining of representative liver section in hMet model. The images in the black squares were enlarged with the scale bar of 200 μm. (O) Epcam distribution in liver samples of hmet model was detected by IHC. (P) Wnt5b, Fzd5, and β‐catenin expression in serial section of liver in hMetS45Y‐β‐catenin model were detected by IHC.
