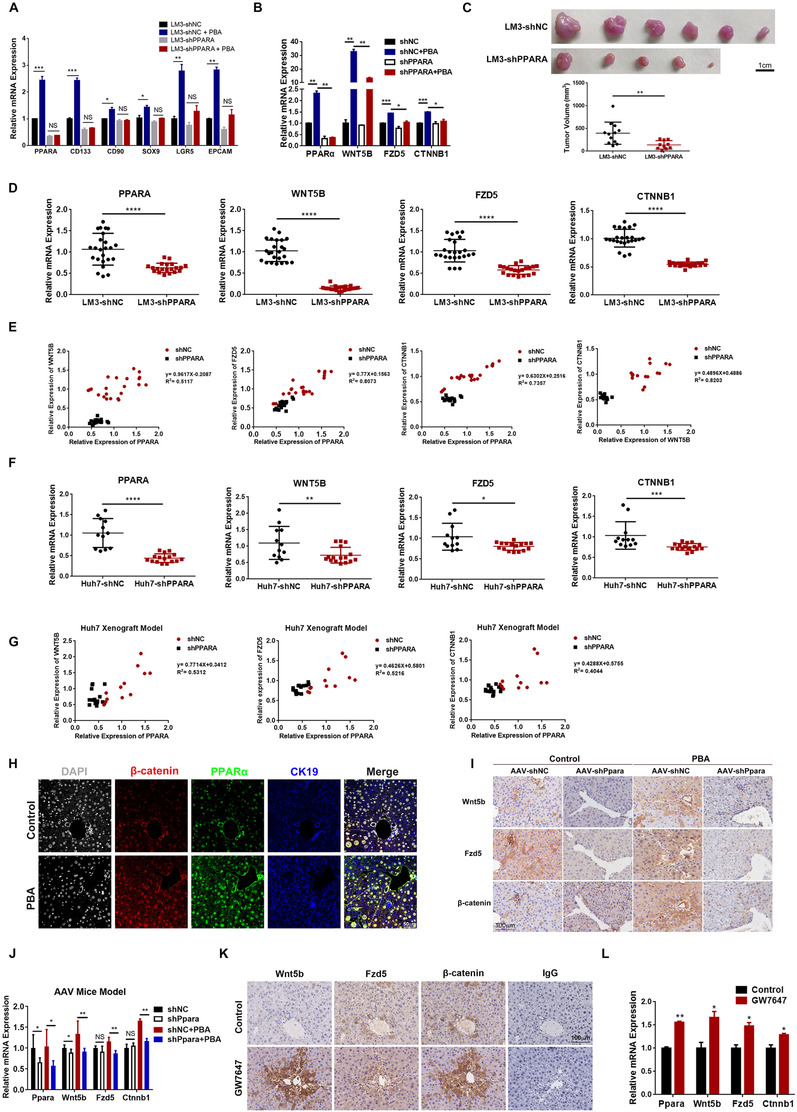
FIGURE 6.

PPAR‐α was associated with Wnt5b‐β‐catenin signaling activation. (A) Relative expression of CSC‐related genes (CD133/CD90/EPCAM/SOX9/LGR5) in LM3‐shNC and LM3‐shPPARA was determined by RT–PCR. *p < 0.05, **p < 0.01, ***p < 0.001. (B) Relative expression of WNT5B, FZD5, and CTNNB1 in LM3‐shNC and LM3‐shPPARA with or without 4‐PBA in culture medium for 24 h was determined by RT–PCR. (C) Representative photographs of tumors formed in Xenograft model implanted with LM3‐shNC and LM3‐shPPARA with 4‐PBA supplemented in drinking water for 4 weeks. Tumor volume of each animal investigated was measured. **p < 0.01. (D) Relative expression of PPARA, WNT5B, FZD5, and CTNNB1 in tumors was determined by RT‐PCR. ****p < 0.0001. (E) The relative expression of PPAR‐α in tumors formed in A was positively correlated to the expression of WNT5B, FZD5 and CTNNB1, respectively. WNT5B expression is also positively correlated with CTNNB1. (F) Relative expression of PPARA, WNT5B, FZD5, and CTNNB1 in tumors formed with Huh7‐shNC, and Huh7‐shPPARA was determined by RT‐PCR. (G) The relative expression of PPARA in tumors was positively correlated to the expression of WNT5B, FZD5, and CTNNB1, respectively. (H) Representative images of multiplexed immunohistochemistry staining of CK19 (blue), β‐catenin (red) and PPAR‐α (green) in liver section from DEN model for 6 weeks. Scale bar: 50 μm. (I) IHC staining of Wnt5b, Fzd5 and β‐catenin in serial section of liver samples from DEN model with AAV‐shNC or AAV‐shPpara were presented. Scale bar: 100 μm. (J) Relative expression of Ppara, Wnt5b, Fzd5, and Ctnnb1 in liver samples in I was determined by RT‐PCR. (K) IHC staining of Wnt5b, Fzd5 and β‐catenin in serial section of liver samples from DEN model with GW7647 treatment instead of 4‐PBA. Scale bar: 100 μm. (L) Relative expression of Ppara, Wnt5b, Fzd5, and Ctnnb1 in K. *p < 0.05, **p < 0.01
