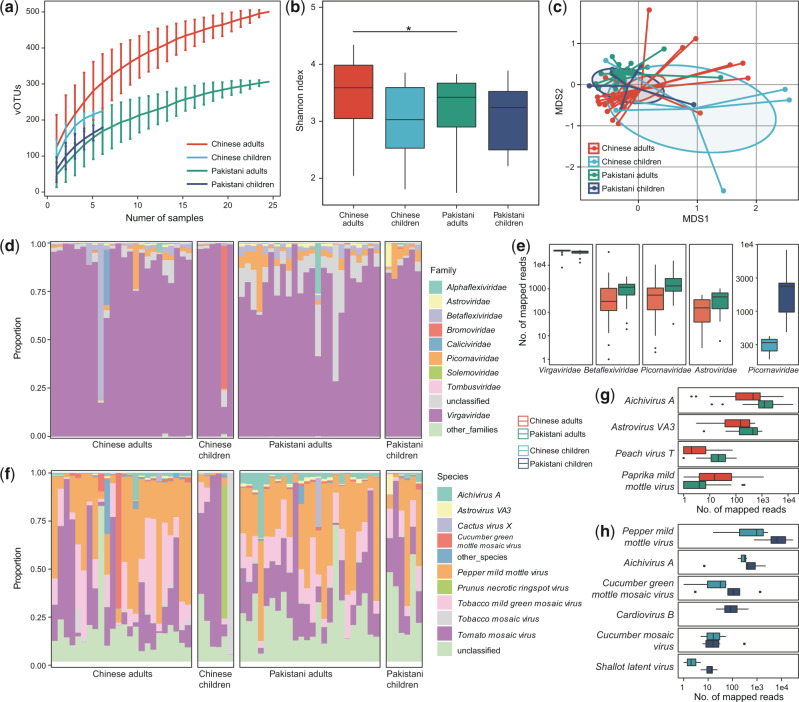
Figure 4.
Differences in gut RNA virome between Chinese and Pakistanis. (a) Rarefaction curve analysis of number of vOTUs on each group of samples. The number of identified vOTUs in different groups is calculated based on a randomly selected specific number of samples with 30 replacements, and the median and quartiles numbers are plotted. (b) Boxplot shows the Shannon diversity index among four groups. The significance level in the Student’s t test is denoted as: *q < 0.05; **q < 0.01. (c) NMDS analysis based on the composition of virome, revealing the separations between different groups. The location of samples (represented by nodes) in the first two multidimensional scales are shown. Lines connect samples in the same group, and circles cover samples near the center of gravity for each group. (d) Composition of gut virome at the family level. (e) Boxplot shows the differential viral families between Chinese and Pakistanis. (f) Composition of gut virome at the species level. Boxplot shows the differential viral families of adults (g) and children (h) when compared between Chinese and Pakistanis. For boxplot, boxes represent the interquartile range between the first and third quartiles and median (internal line); whiskers denote the lowest and highest values within 1.5 times the range of the first and third quartiles, respectively; and nodes represent outliers beyond the whiskers.

