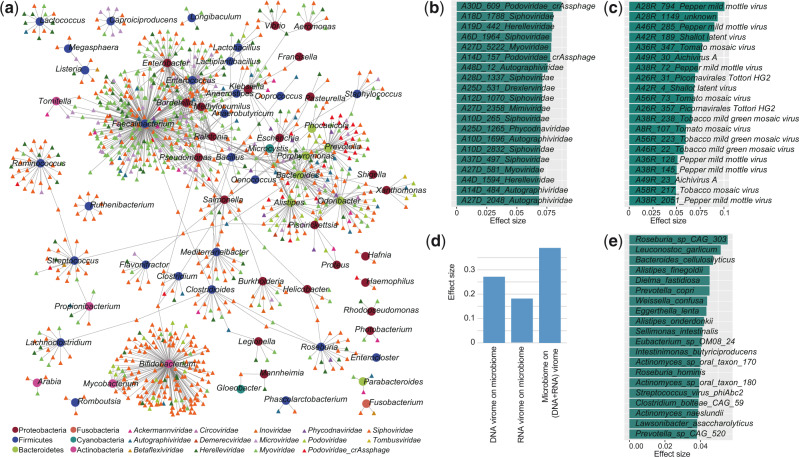
Figure 7.
Associations between virome and bacterial microbiome. (a) Host range of viruses predicted through CRISPR spacer matches. Circles and tringles represent the bacteria and viruses, respectively; and the colors represent their taxonomic assignment at the phylum (for bacteria) or family (for viruses) levels. The twenty DNA (b) and RNA families (c) for which the highest effect size that significant impact the bacterial microbiome communities. (d) The combined effect size of viruses on bacterial microbiome as well as bacteria on virome. To calculate the combined effect size, a set of non-redundant covariates (DNA vOTUs, RNA vOTUs, or bacterial species) is selected from the omic datasets, and then the accumulated effect size is calculated by adonis analysis using these selected covariates. (e) The twenty bacterial species with highest effect size for impacting the combined DNA and RNA viral communities.

