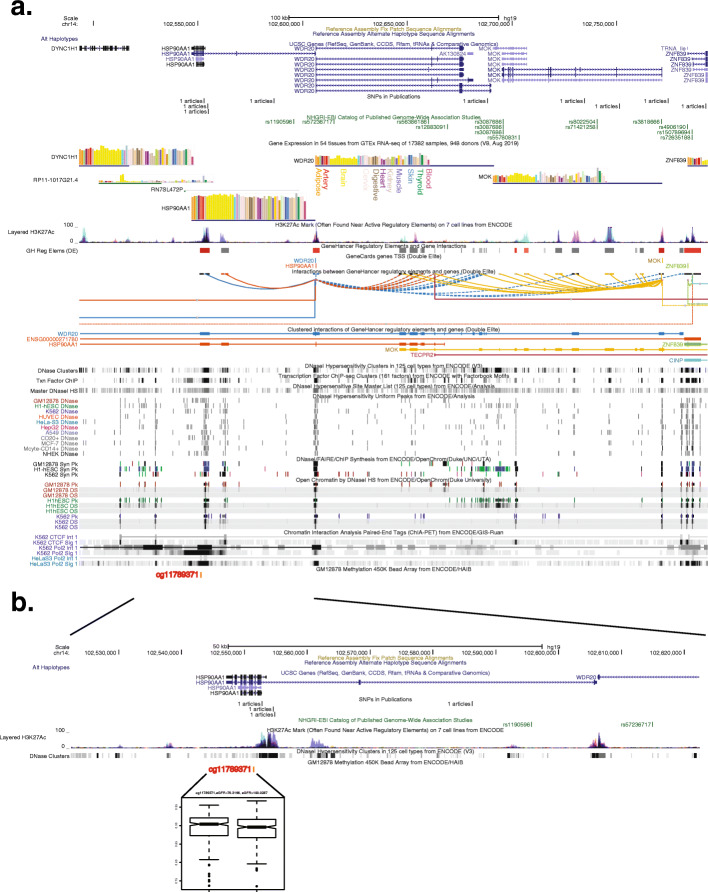
Fig. 2.
eGFR-associated differentially methylated position cg11789371. a HSP90AA1 gene browser shot showing (from top to bottom) genome coordinates, local genes, NHGRI/EBI GWAS catalog SNPs, GTEx gene expression quantified via RNA-seq across different tissues, H3K27ac peaks across 7 ENCODE cell lines, GeneHancer regulatory elements, Genecards TSSs, GeneHancer chromatin interactions, ENCODE chromatin accessibility and chromatin interaction tracks, and location for eGFR-associated DMP cg11789371. b Expanded browser shot showing genome coordinates, local genes, NHGRI/EBI GWAS catalog SNPs, H3K27ac peaks across 7 ENCODE cell lines, and a boxplot indicating DNAm values at cg11789371 for bottom and top quartiles of eGFR, respectively. These data indicate our DMP overlaps an intron of HSP90AA1, a gene expressed in kidney tissue, and a DHS from ENCODE, which was detected in kidney tissue. Our DMP is also proximal to an H3K27ac peak, an RNA Polymerase 2 region determined by ENCODE ChIA-PET across several cell lines, and the promoter of HSP90AA1. All browser shots were generated using the UCSC genome browser (https://genome.ucsc.edu/) on human genome build hg19

