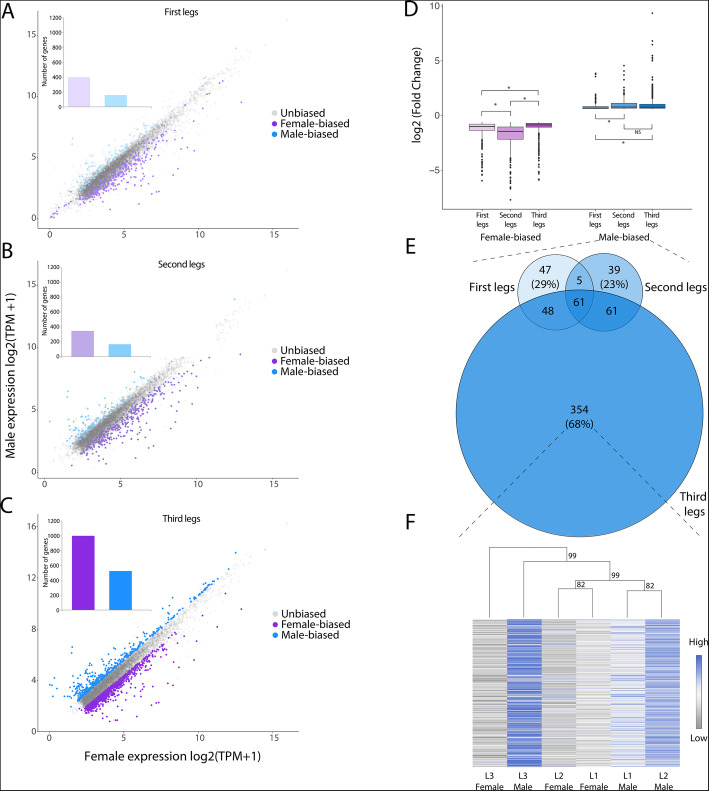
Fig. 2.
Signature of trait exaggeration among sex-biased genes. a–c Comparison of gene expression (log2 TPM + 1) in male and female legs. Dots highlighted in purple and blue represent genes with significant difference in expression in females and males respectively. Insets indicate the number of female- and male-biased genes in each leg. d Differences in fold change (Wilcoxon tests) among the sex-biased genes identified in the three pairs of legs independently. e Venn diagrams of the male-biased genes identified in the three pairs of legs. Size of the diagrams is proportional to the total number of genes. f Hierarchical clustering (1000 bootstraps) and heatmap based on average leg expression in males and females for the genes with significant male-biased expression specifically in the third legs of males (n = 354)

