Figure 1.

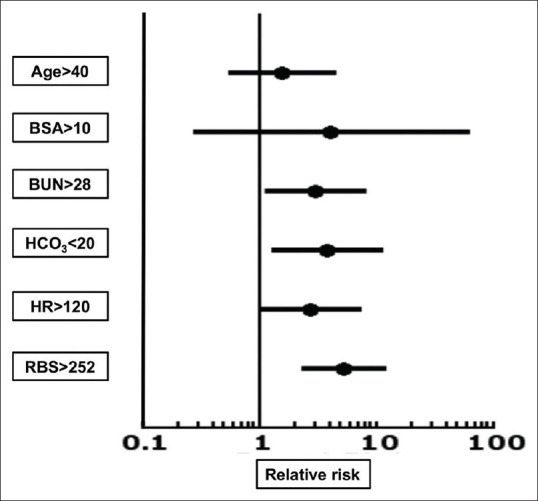
Forest plot showing relative risk ratio (after univariate logistic regression) of components of SCORTEN to mortality (*Relative risk of malignancy could not be calculated as none of the patients had malignancy in our study)

Forest plot showing relative risk ratio (after univariate logistic regression) of components of SCORTEN to mortality (*Relative risk of malignancy could not be calculated as none of the patients had malignancy in our study)