FIG 1.
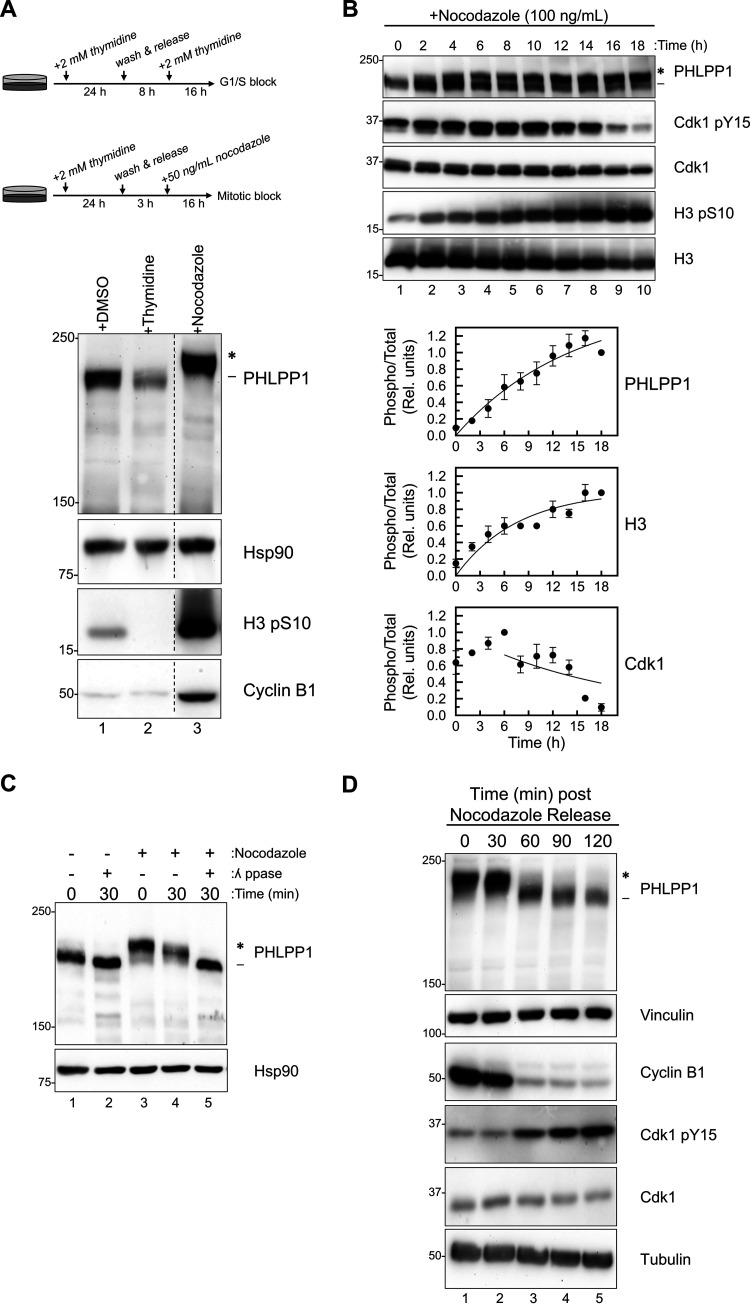
PHLPP1 phosphorylation is cell cycle dependent. (A) Western blot of RPE1 cells treated with either DMSO (asynchronous), double-thymidine block (G1/S), or thymidine/nocodazole block (M). Western blots are representative of four independent experiments. Lanes in the blot that were irrelevant to this experiment were removed (indicated by the dashed line). (B) Western blot of HEK-293A cells treated with nocodazole (100 ng/ml) for indicated amounts of time. Graphs show the quantification of three independent experiments for PHLPP1 and Cdk1 and two independent experiments for H3. Values are the ratio of the signal of phosphorylated protein to total protein (relative units) ± SEM. For PHLPP1, the ratio was calculated as the signal of the slower-mobility species (*) divided by the total PHLPP1 signal (* and -) normalized to the 18-h time point. For Cdk1, the ratio was calculated as the Cdk1 pY15 signal divided by the total Cdk1 signal normalized to the 6-h time point. For H3, the ratio was calculated as the signal of the H3 pS10 divided by total H3 signal normalized to the 18-h time point. Data analysis was performed using GraphPad Prism 8. (C) Lysates from asynchronous (lanes 1 and 2) or nocodazole-treated (lanes 3, 4, and 5) HEK-293A cells were incubated at 25°C with or without λ phosphatase (ppase) for indicated amounts of time. All blots are probed against endogenous proteins. Three independent experiments were performed. (D) Western blot of mitotic RPE1 cells that were collected, washed, and released from a thymidine/nocodazole block. Western blots are representative of three independent experiments. The asterisk shows the PHLPP1 electrophoretic mobility shift compared to faster-mobility species (dash).

