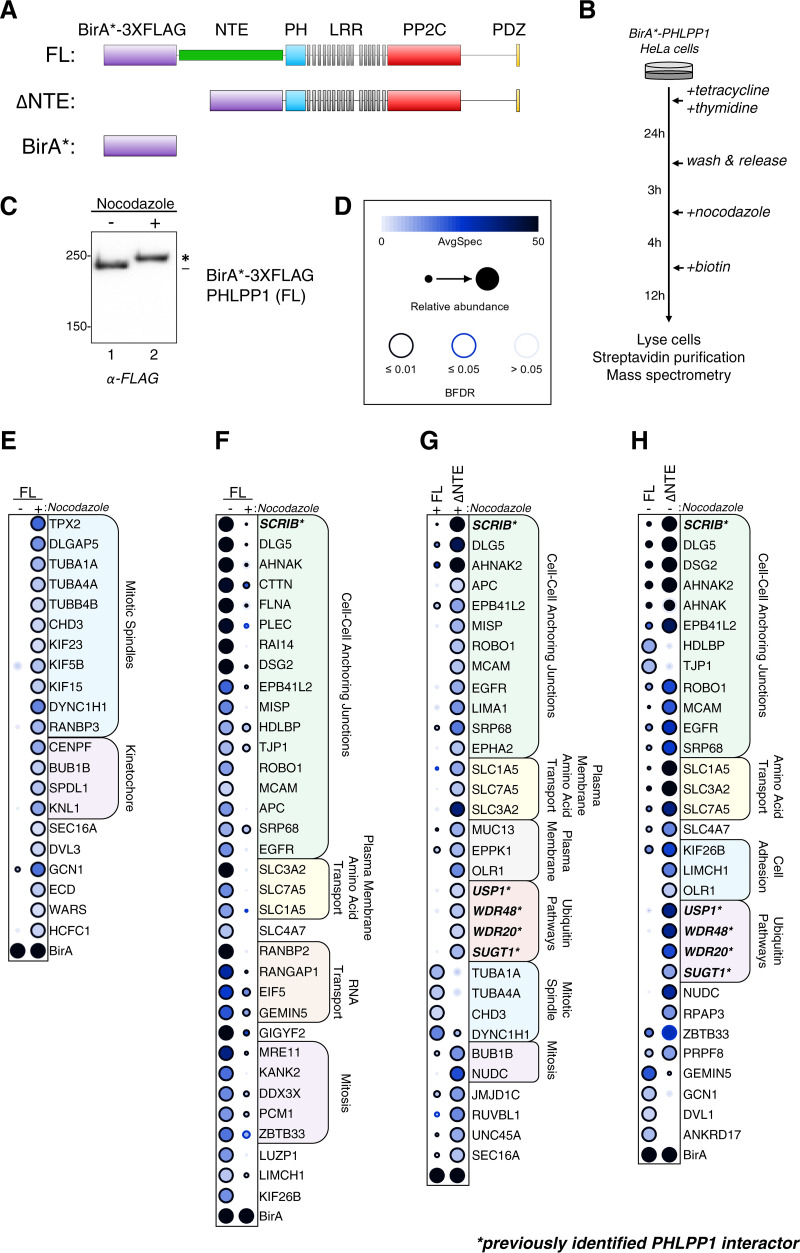
FIG 4.
BioID screen to determine changes in the mitotic PHLPP1 interactome. (A) Tetracycline-inducible Flp-IN T-REx HeLa cells expressing the following constructs were generated: full-length PHLPP1 (amino acids 1 to 1717 [FL]) and N-terminally truncated PHLPP1 (amino acids 513 to 1717 [ΔNTE]), fused with BirA* biotin ligase (R118G mutation) and a 3×FLAG tag. Additionally, cells expressing only the BirA*-3×FLAG tag were generated (BirA*). (B) BioID experimental workflow. (C) Western blot of BirA*-3×FLAG-PHLPP1 FL Flp-In T-REx HeLa cells treated or not treated with nocodazole. The blot was probed with an anti-FLAG antibody. (D) Legend for BioID dot plot analysis, where AvgSpec refers to averaged spectral counts across the biological duplicates (BFDR, false discovery rate). (E and F) Dot plots of prey that display either a ≥2-fold enrichment in nocodazole-treated (mitotic) versus DMSO-treated (asynchronous) cells expressing full-length (FL) PHLPP1 (E) or ≥2-fold enrichment in DMSO-treated (asynchronous) versus nocodazole-treated (mitotic) cells expressing FL PHLPP1 (F). (G) Dot plot of prey that display ≥2-fold enrichment or ≥2-fold depletion in nocodazole-treated ΔNTE cells compared to nocodazole-treated FL PHLPP1-expressing cells. (H) Dot plot of prey that display ≥2-fold enrichment or ≥2-fold depletion in DMSO-treated ΔNTE cells compared to FL cells. Boldface type and asterisks indicate previously identified PHLPP1-interacting proteins. The asterisk in panel C indicates PHLPP1 electrophoretic mobility shift compared to faster-mobility species (dash).

