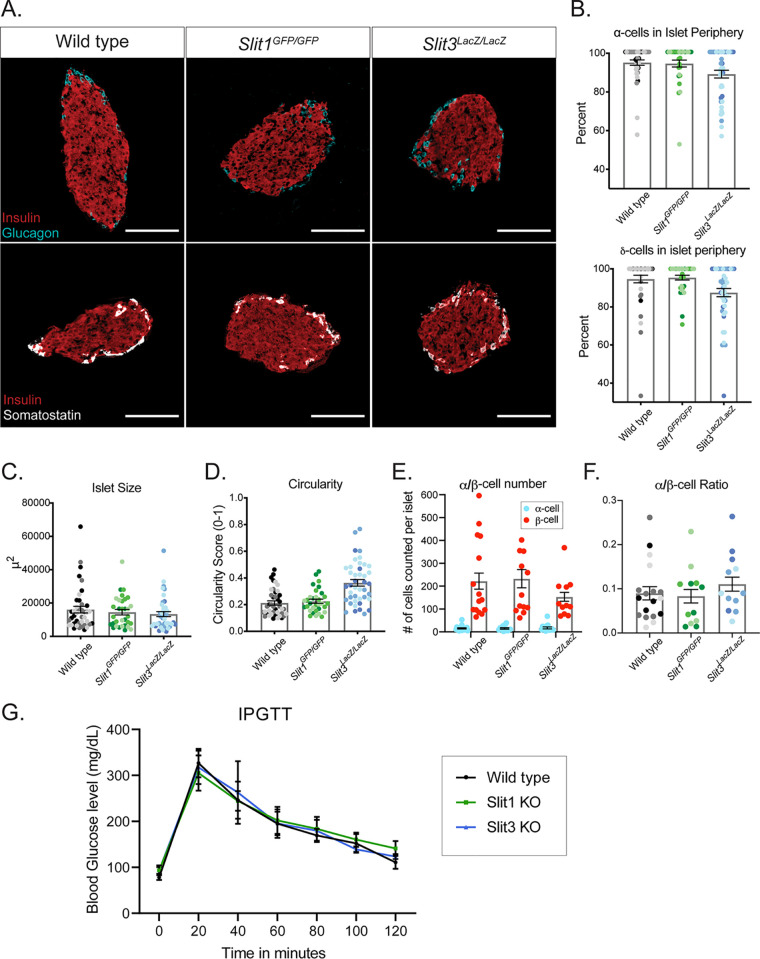
FIG 3.
Loss of a single Slit ligand does not compromise islet architecture or glucose metabolism. (A) Immunofluorescence staining of β cells (insulin, red), α cells (glucagon, cyan), and δ cells (somatostatin, white) in adult (∼8-week-old) homozygous knockout mice. Scale bars, 100 μm. n = 3 for each genotype analyzed. (B) Percentage of α cells and δ cells found in the islet periphery. (C) Average islet size. (D) Average islet circularity (as noted by a circularity score of 0 to 1, where 1 is a perfect circle). (E) α/β-Cell number per islet. (F) α/β-Cell ratio per islet. (G) IPGTT on mice fasted overnight. Wild type, n = 6; Slit1GFP/GFP (Slit1 KO), n = 8; Slit3LacZ/LacZ (Slit3 KO), n = 3.

