FIG 6.
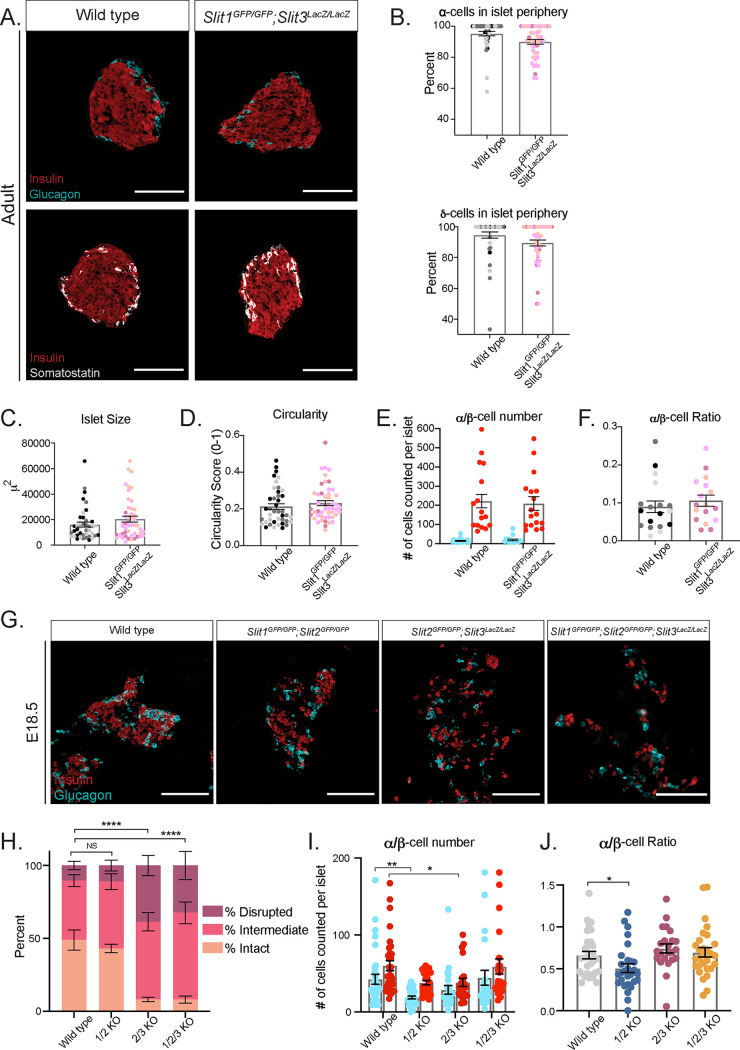
Slit2 and Slit3 compensate for one another in islet morphogenesis. (A) Immunofluorescence staining of β cells (insulin, red), α cells (glucagon, cyan), and δ cells (somatostatin, white) in adult (∼8-week-old) homozygous Slit1GFP/GFP; Slit3LacZ/LacZ knockout mice. Scale bars, 100 μm. (B) Percentage of α cells and δ cells found in the islet periphery. (C) Average islet size. (D) Average islet circularity (as noted by a circularity score of 0 to 1, where 1 is a perfect circle). (E) α/β-Cell number per islet. (F) α/β-Cell ratio per islet. (G) Immunofluorescence staining of β cells (insulin, red) and α cells (glucagon, cyan) in wild-type, double, and triple knockout mice at E18.5/P0. Scale bars, 100 μm. (H) Percentages of islets from each genotype that were scored as intact, intermediate, or disrupted. ****, P < 0.0001 by chi-square test. (I) α/β-Cell number per islet. *, P < 0.05; **, P < 0.01. (J) α/β-Cell ratio per islet. *, P < 0.05. n = 3 for all genotypes at each age analyzed.

