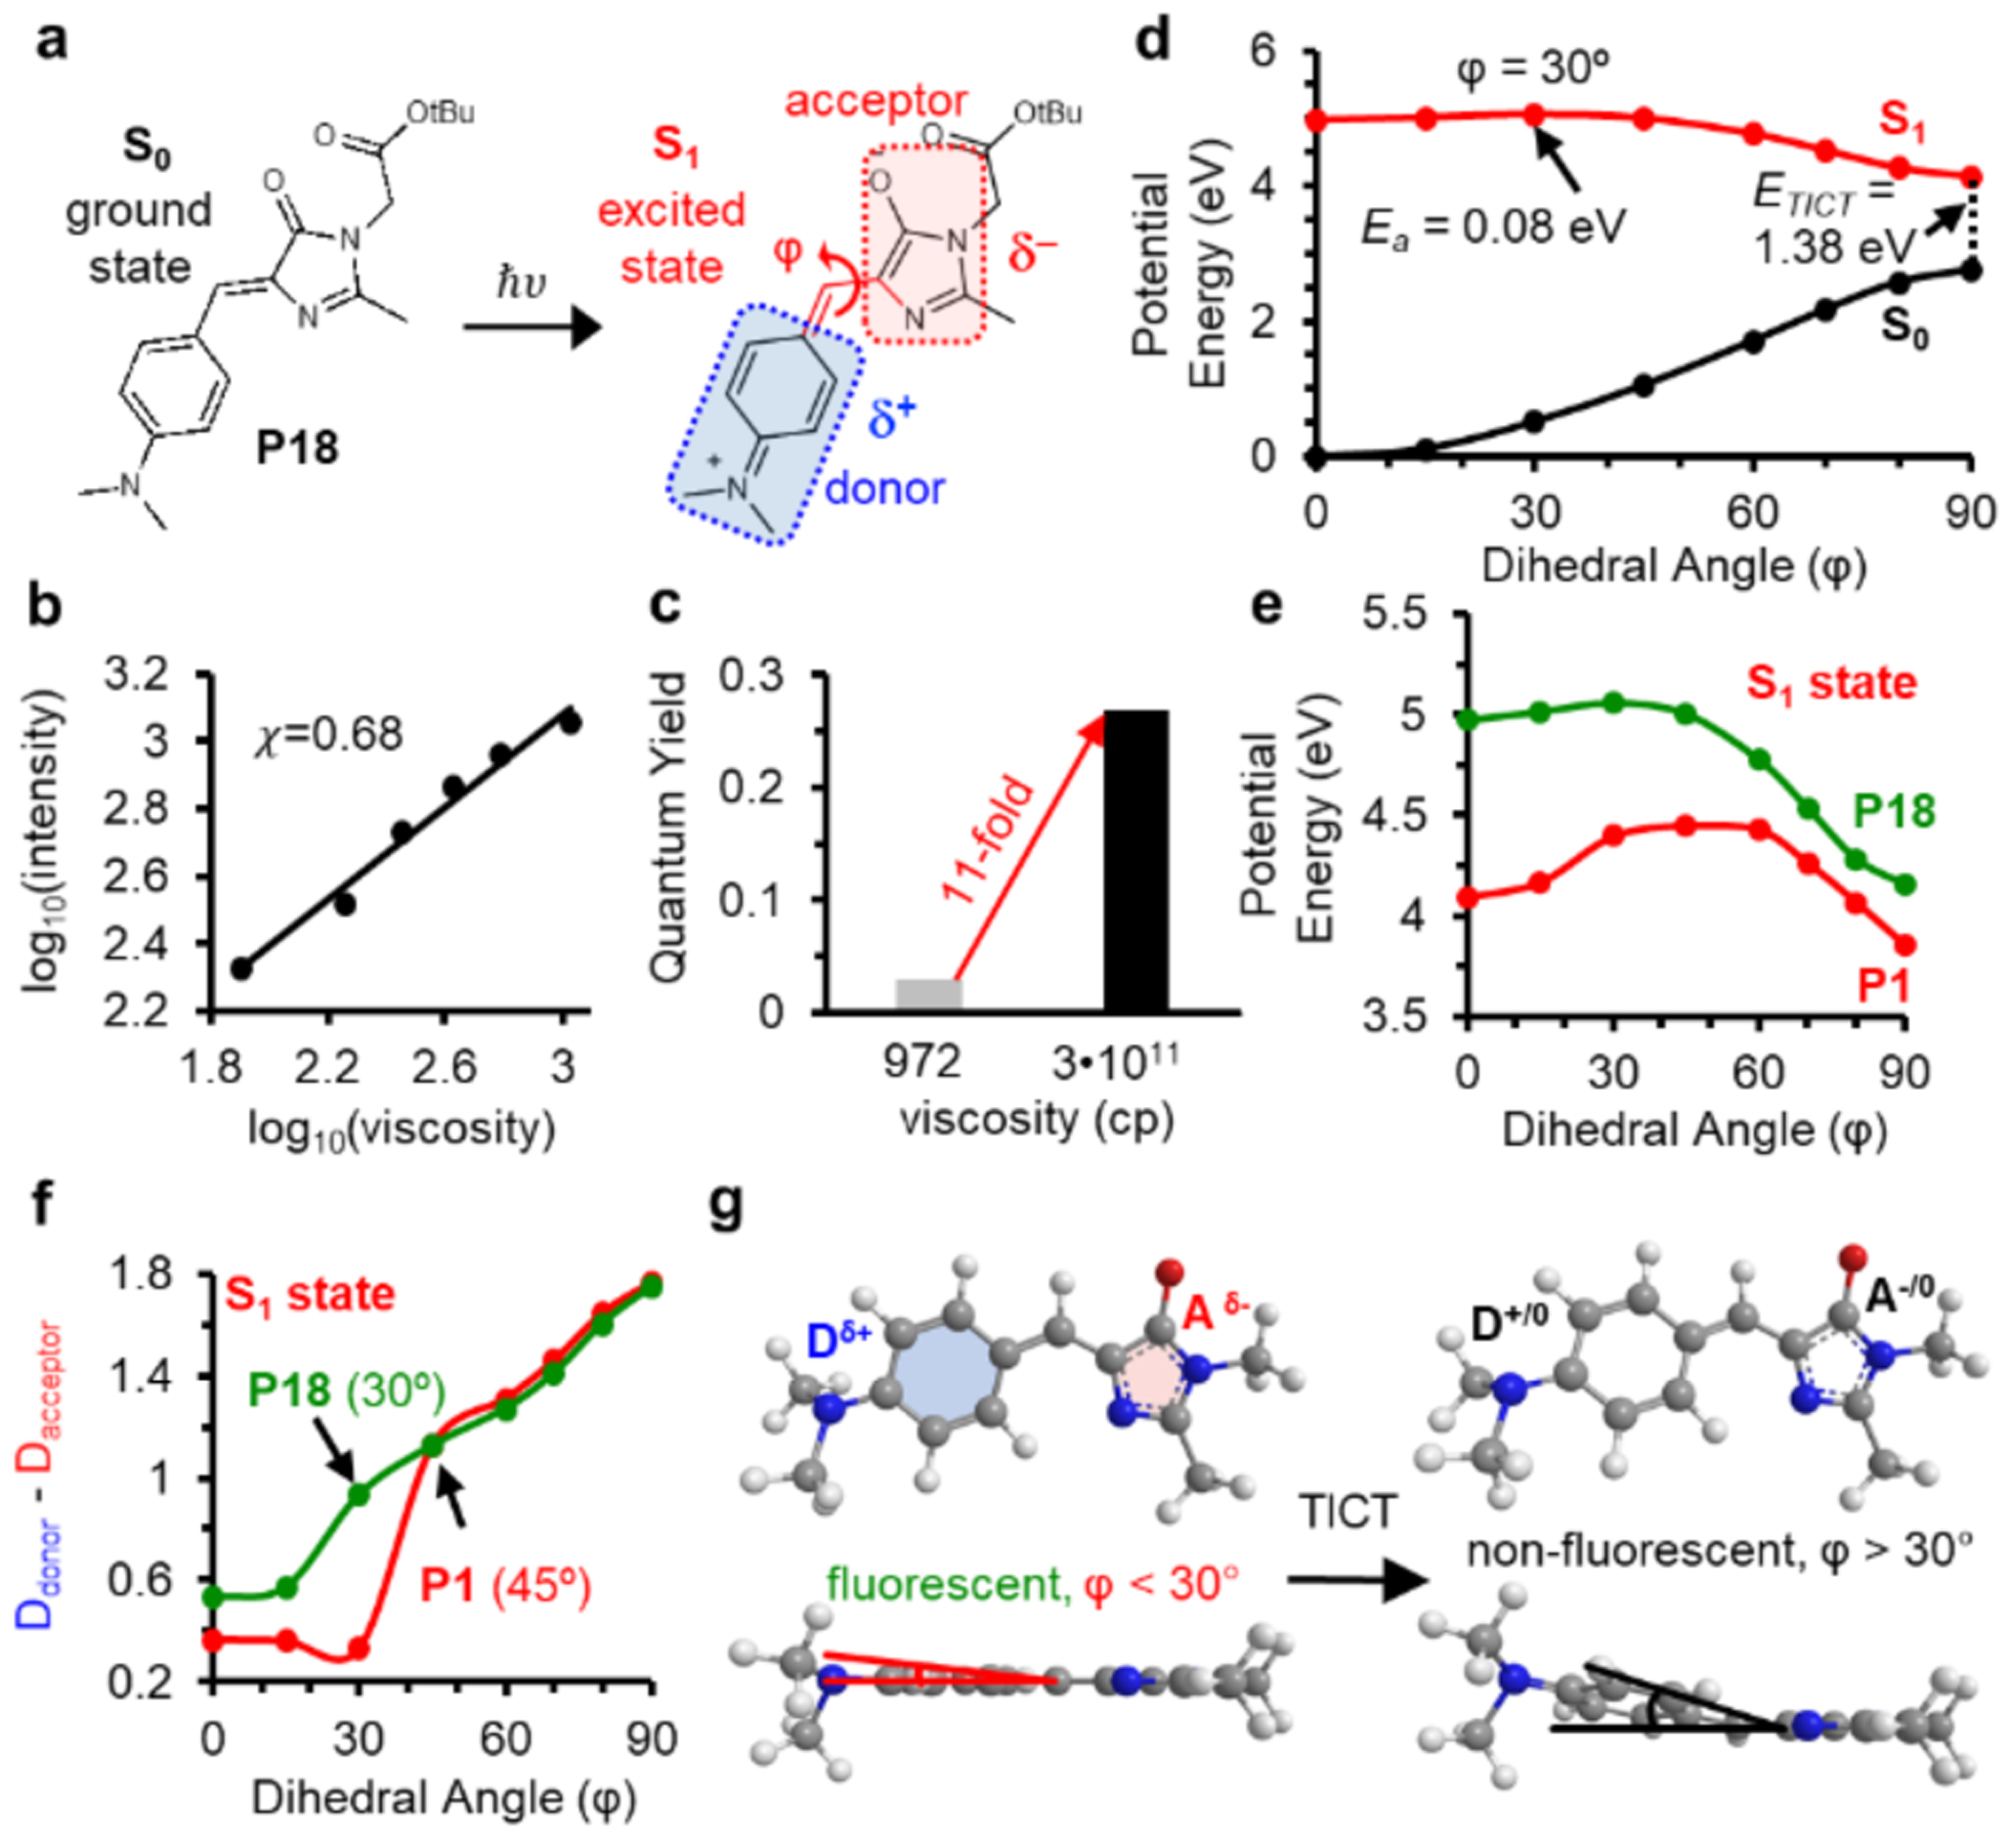
Figure 4: Mechanisms underlying the different fluorescent activation behavior of P1 and P18.

a) Structure of P18 and diagram showing the donor and acceptor of P18 upon excitation. b) Viscosity sensitivity (x = 0.68) of P18. c) Fluorescent intensity of P18 increase by 11-fold from glycerol (972 cp) to glycerol at −80°C (3•1011 cp) d) SA-CASSCF rigid scan over angle φ identifies the excited state rotational barrier at 30° with Ea = 0.06 eV. e) Rotational potential energy surfaces of P1 (red) and P18 (greed) at the S1 excited state. f) Mulliken charge analyses reveals TICT initiates at φ angles of 45° for P1 and 30° for P18. g) TICT for P18 initiates at rotational angles greater than 30°.
