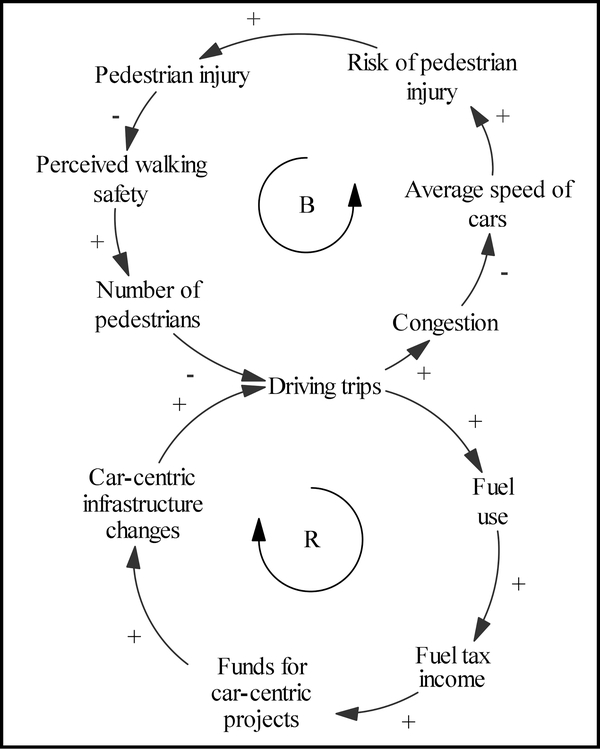
FIGURE 3.
Example causal loop diagram demonstrating hypothesized balancing (B) and reinforcing (R) feedback loops
Arrows represent hypothesized causal relationships; “+” is translated as: a change in the factor that an arrow is originating from causes a change in the factor that the arrow is pointing to in the same direction, all else held equal; “-” is translated as: a change in the factor that an arrow is originating from causes a change in the factor that the arrow is pointing to in the opposite direction, all else held equal.

