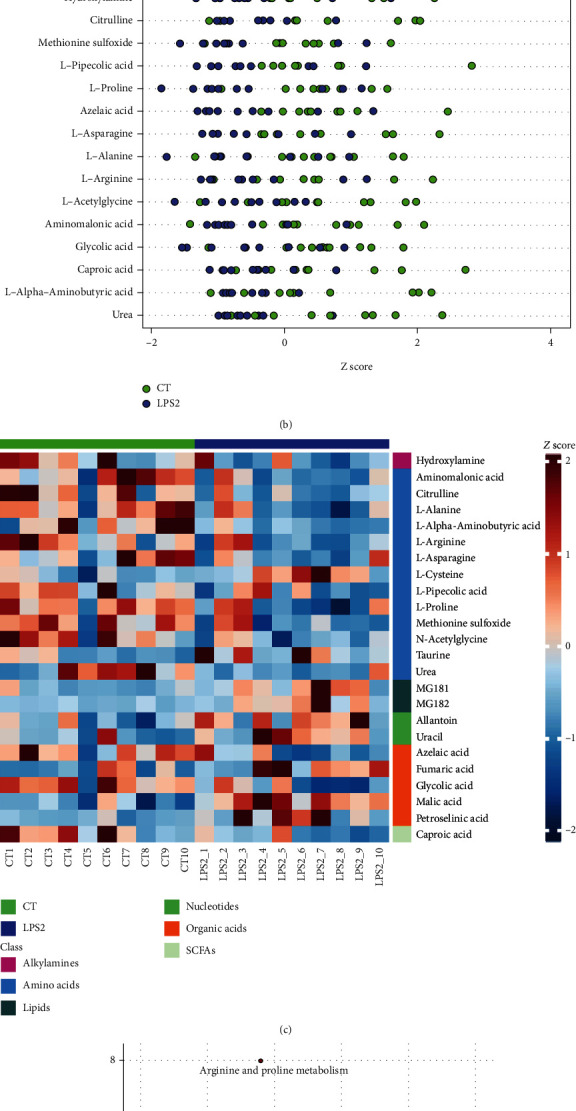
Figure 4.

(a) Venn diagram of differential metabolites identified by multivariate and univariate statistical methods. (b) Z score plots of 24 potential biomarkers. (c) Z score heat map of 24 potential biomarkers according to the classes with names (CT vs. LPS 2). (d) Overview of pathway analysis. Metabolic pathway enrichment analysis (MPEA) was performed to identify the most relevant metabolic pathways.
