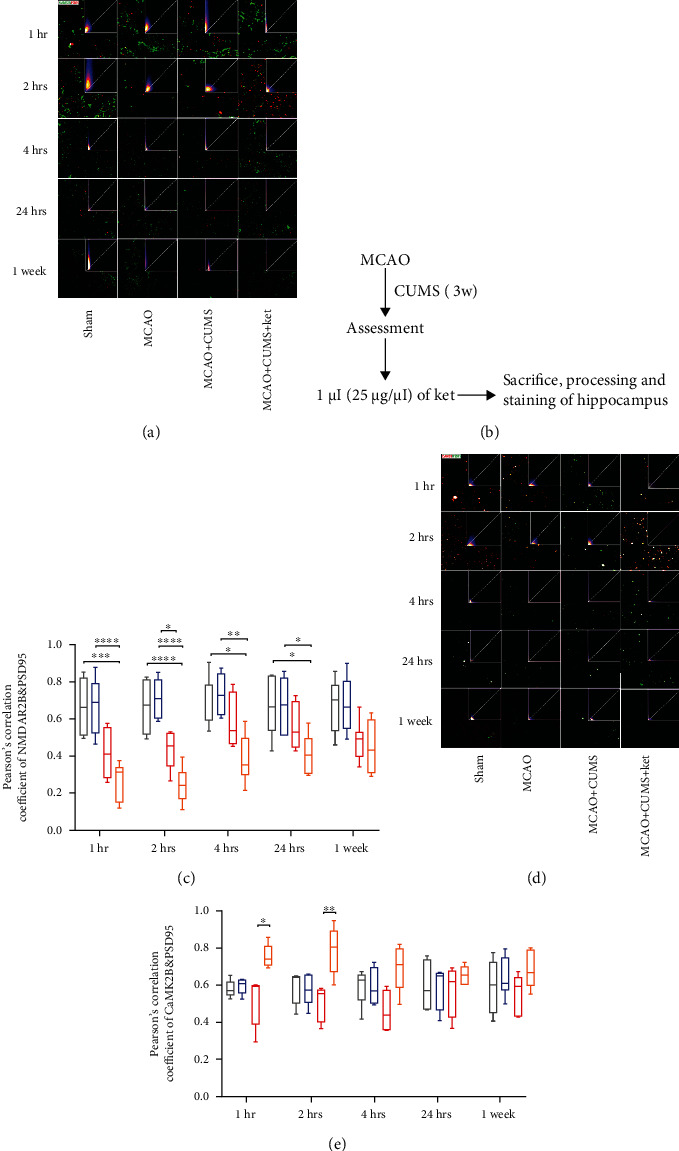
Figure 4.

Analysis of the relationship between the NMDAR/CaMKII pathway and changes at the postsynaptic level by colocalization. (a) Representative confocal images of the relationship between NR2B (labeled in green) and PSD95 (labeled in red). The upper right corner of each image shows the corresponding scattergram with pixel concentration along the diagonal, depending on the degree of colocalization. (b) Schedule and procedures before image acquisition. (c) Colocalization between NR2B and PSD95, as analyzed by Pearson's correlation coefficients. (d) Representative confocal images of the relationship between CaMK2B (labeled in red) and PSD95 (labeled in green). The upper right corner of each image shows the corresponding scattergram with pixel concentration along the diagonal, depending on the degree of co-localization. (e) Colocalization between CaMK2B and PSD95, as analyzed by Pearson's correlation coefficients. Scale bar: 20 μm. Pearson's correlation coefficient analysis was based on ten sight fields in each group. n = 6 per group. 1 hr: 1 hour, 2 hrs: 2 hours, 4 hrs: 4 hours, 24 hrs: 24 hours, and 3 w: 3 weeks. ∗p < 0.05, ∗∗p < 0.005, ∗∗∗p < 0.0005, and ∗∗∗∗p < 0.0001.
