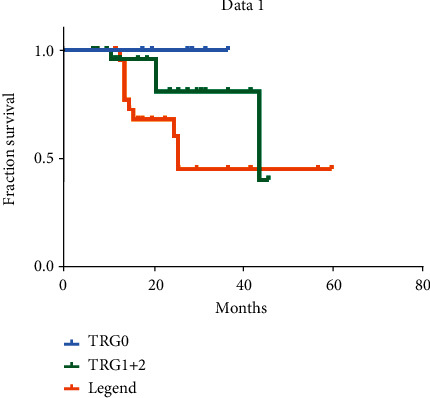
Figure 1.

Survival curves of the 62 patients who underwent NAC and radical gastrectomy based on pathological regression grades. The X-axis denotes the survival time in months. TRG0 (blue curve) refers to the group with a significant pathological response, TRG1+2 (green curve) refers to the group with a partial pathological response, and TRG3 (orange curve) refers to the group with no pathological response.
