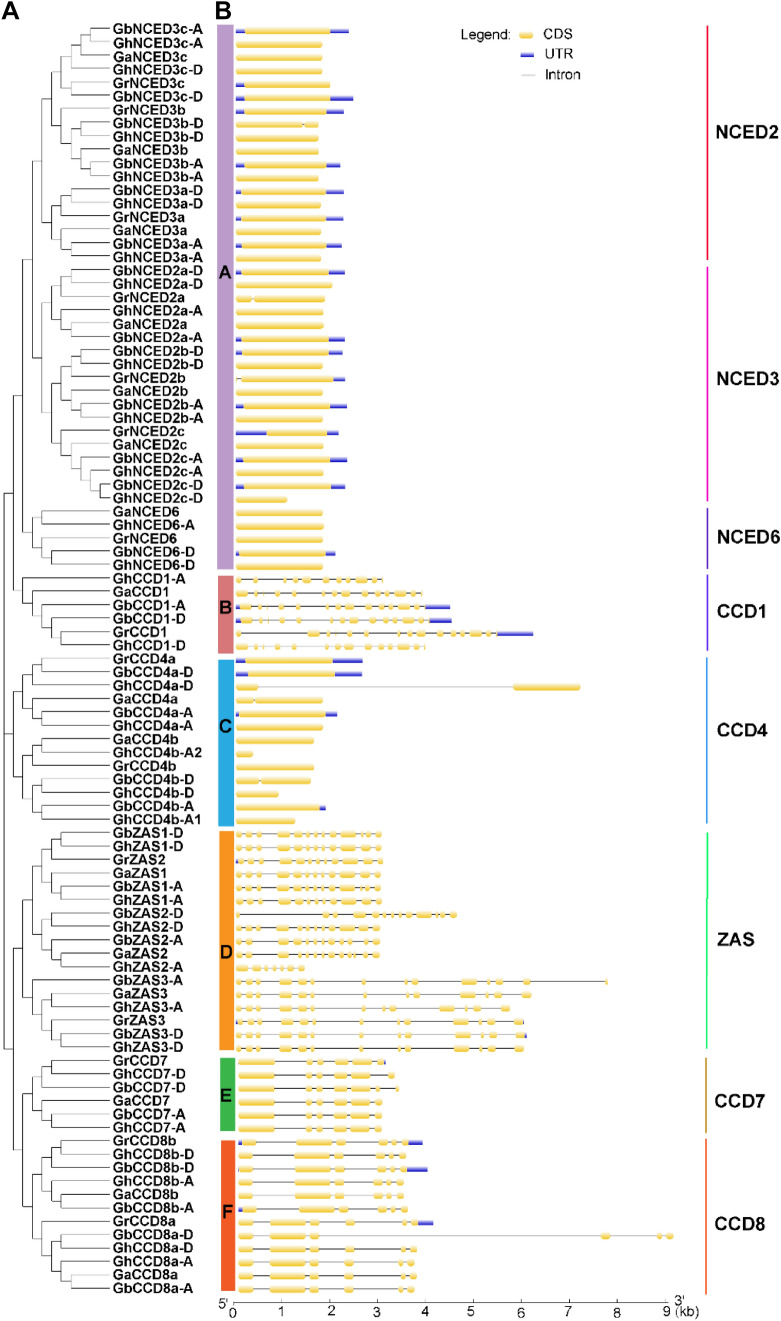
Fig. 2.
Gene structures of CCD genes from different Gossypium spp.. a The phylogenetic tree was constructed using the Neighbor-Joining (NJ) method, with 1000 bootstrap replicates. Sub-families are distinguished by different colors. b Exon/intron architectures of CCD genes from different Gossypium spp.. Yellow and blue boxes indicate exons and UTRs, respectively. Black lines represent introns. The size of exons and introns can be calculated according to the scale at the bottom

