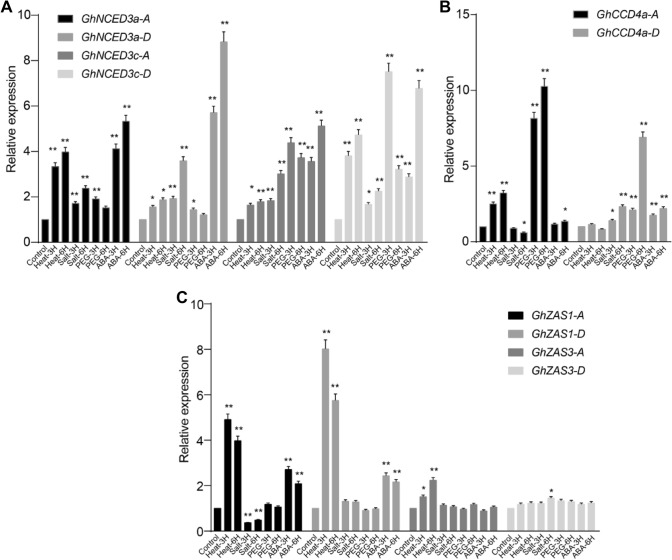
Fig. 7.
qRT-PCR expression analysis of selected GhCCD genes under different abiotic stresses treatments or upon exposure to exogenous ABA for 3 h and 6 h. Relative expression level of selected GhNCEDs (a), GhCCD4s (b) and GhZASs (c) under different conditions. Relative gene expression levels were normalized to the reference gene (GhHistone 3) and were re-adjusted to the expression levels in the control, which were set as 1. Average fold change ± SE (n = 3). Two-tailed Student’s t-test, *P < 0.05, **P < 0.01

