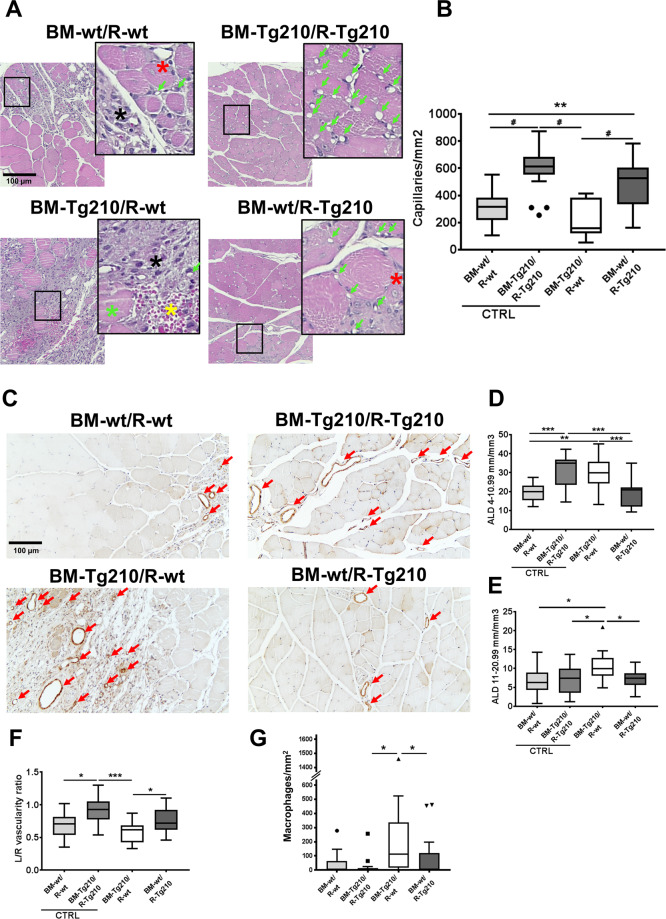
Fig. 2. BM-Tg210/R-wt muscles display impaired tissue repair, dysfunctional angiogenesis, and decreased calf perfusion after ischemia.
A Representative H/E stained sections of ischemic gastrocnemius muscles of BM-wt/R-wt, BM-Tg210/R-Tg210, BM-Tg210/R-wt, and BM-wt/R-Tg210 mice. Magnification ×200. Calibration bar 100 µm. Insets show magnifications of the indicated areas. Green arrows indicate capillaries; black asterisks indicate areas of inflammation, green asterisks indicate degenerating myofibers, red asterisks indicate regenerating myofibers (i.e., small myofibers with central nucleus) and yellow asterisks indicate extravasated erythrocytes. B Capillary density quantification (n = 16–18, Anova multiple comparison **P < 0.002, #P < 0.0001). C Representative α-SMA immunohistochemistry of ischemic gastrocnemius muscles of BM-wt/R-wt, BM-Tg210/R-Tg210, BM-Tg210/R-wt, and BM-wt/R-Tg210 mice. Red arrows indicate arterioles. Magnification ×200, calibration bar 100 µm. D, E Arteriolar length density (ALD) quantification. Arterioles were classified on the basis of the minimum internal diameter as small (4–10.99 μm in D) and medium (11–20.99 μm in E) (n = 16–18 Anova multiple comparison *P < 0.05; **P < 0.002; ***P < 0.0007). F Calf perfusion was monitored by ultrasound in power Doppler mode and expressed as vascularity ratio of ischemic/non-ischemic limbs (n = 16–18, Anova multiple comparison *P < 0.05; ***P < 0.0001). G Macrophage density quantification (N = 16–18, Kruskal–Wallis test, multiple comparison P < 0.04).

