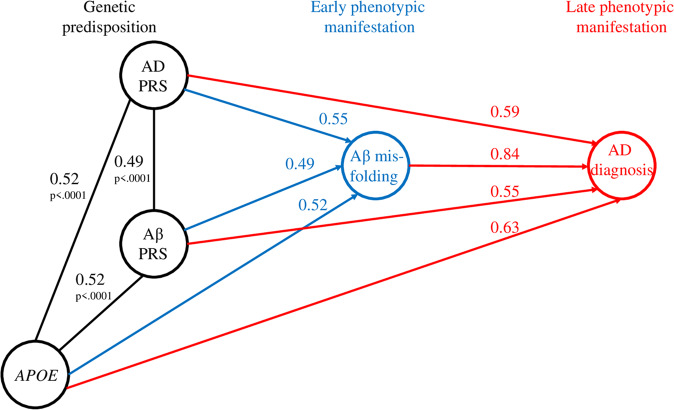
Fig. 3. Overarching relationship between the genetic risk markers, Aβ misfolding, and AD diagnosis measured in area under the curve (AUC) values (shown in blue and red) and Spearman correlation coefficients (shown in black).
The prediction of Aβ misfolding by the genetic risk markers and AD diagnosis by the genetic risk markers and Aβ misfolding is expressed as AUC values and the relationship between genetic risk markers is expressed as Spearman correlation coefficients.

