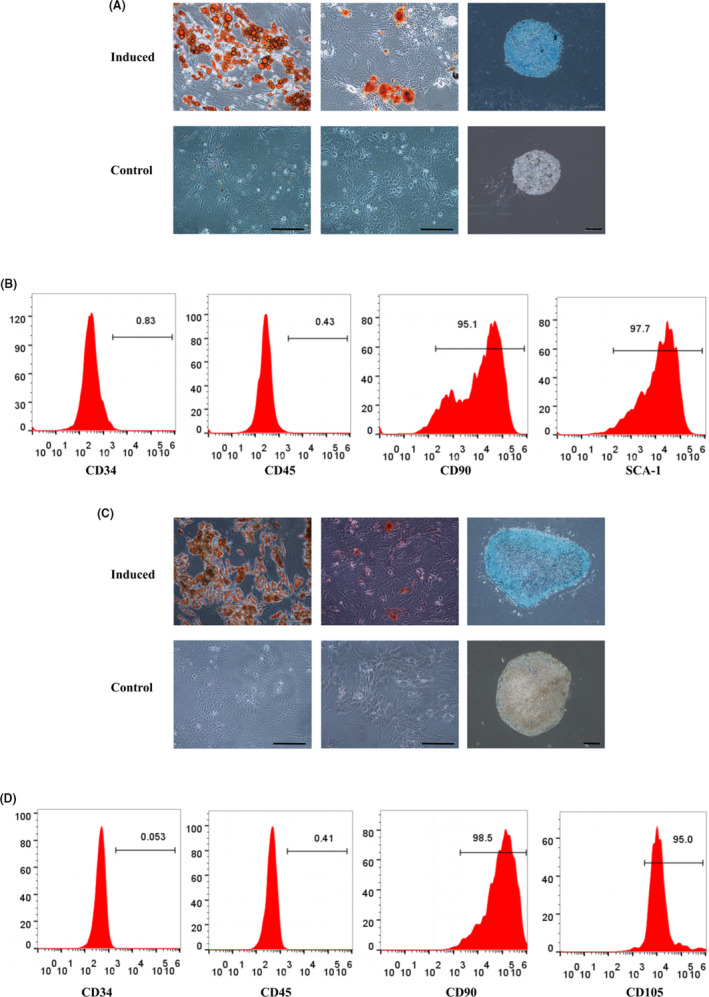
FIGURE 1.

Identification of cultured mADSCs and rADSCs. A, Trilineage differentiation of mADSCs at P3 in vitro. Left: Oil Red O staining; middle: Alizarin red staining; right: Alcian blue staining. B, Flow cytometry analysis of the surface antigens of mADSCs at P3. C, Trilineage differentiation of rADSCs at P3 in vitro. Left: Oil Red O staining; middle: Alizarin red staining; right: Alcian blue staining. D, Flow cytometry analysis of the surface antigens of rADSCs at P3. Scale bar: 200 μm
