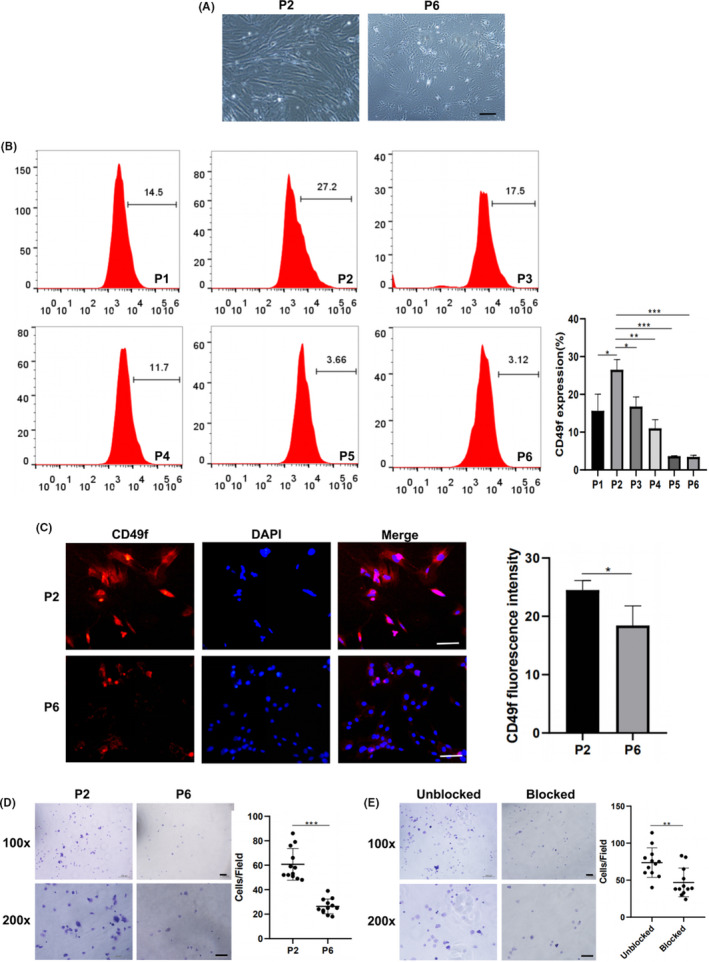
FIGURE 3.

Expression of CD49f on rADSCs at different passage numbers. A, Representative morphology of rADSCs at P2 and P6. B, Flow cytometry analysis of CD49f expression on rADSCs at P1‐P6. C, Immunofluorescence images showing CD49f expression on rADSCs at P2 and P6. D, Assay of rADSCs adhesion to laminin at P2 and P6. E, Assay of rADSCs adhesion to laminin at P3 after blocking CD49f with a monoclonal antibody. Data are expressed as the mean ± SD, *P < .05, **P < .01, ***P < .001. Scale bar: 100 μm
