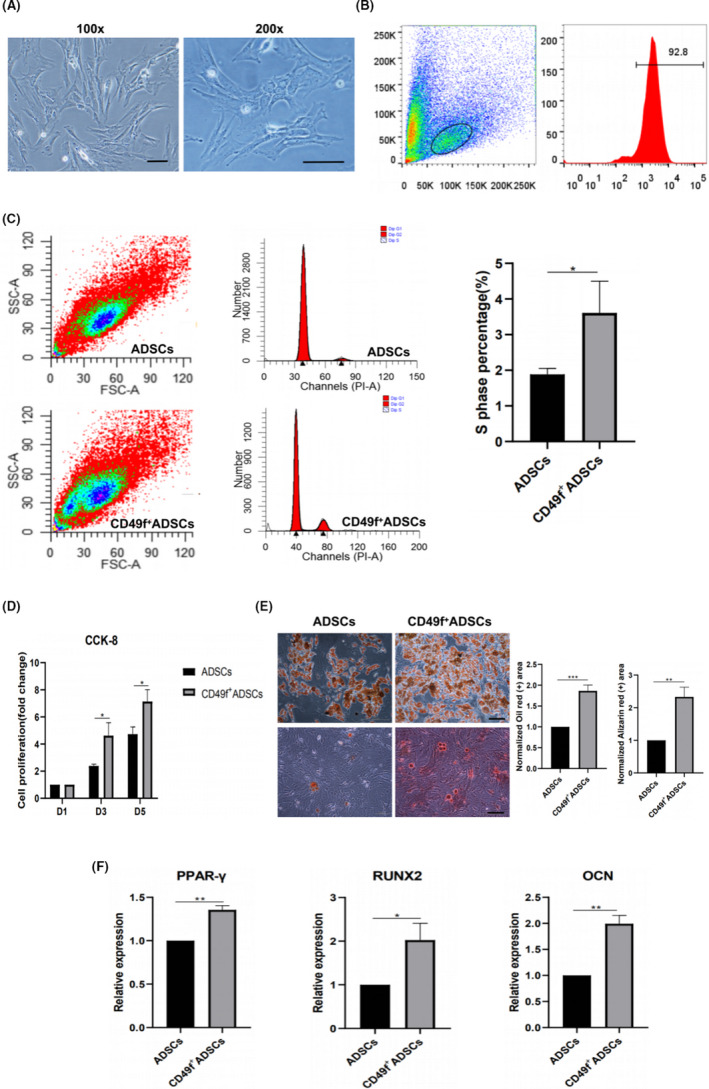
FIGURE 6.

CD49f+ ADSCs exhibited higher proliferation and multiple differentiation abilities than unsorted ADSCs at P3. A, Morphology of CD49f+ ADSCs: the same culture at two different magnifications. B, Flow cytometry analysis of the positive rate of CD49f+ ADSC after enrichment. C, Cell cycle analysis of CD49f+ ADSCs and unsorted ADSCs. D, CCK‐8 assay of CD49f+ ADSCs and unsorted ADSCs. The cell proliferation (fold change) was calculated as follows: , where Ax represents the average OD values of cells at day 1, 3 or 5; Ab represents the average OD values of control plate (without cells); A 1 represents the average OD values of cells at day 1. E, Adipogenic and osteogenic differentiation of CD49f+ ADSCs and unsorted ADSCs. Left: Oil Red O staining; right: Alizarin red staining. F, Relative mRNA expression of an adipogenic marker (PPAR‐γ) at day 7 after adipogenic induction and osteoblast markers (OCN and Runx2) at day 7 after osteogenic induction in CD49f+ ADSCs and unsorted ADSCs. Data are expressed as the mean ± SD, *P < .05, **P < .01, ***P < .001. Scale bar: 100 μm
