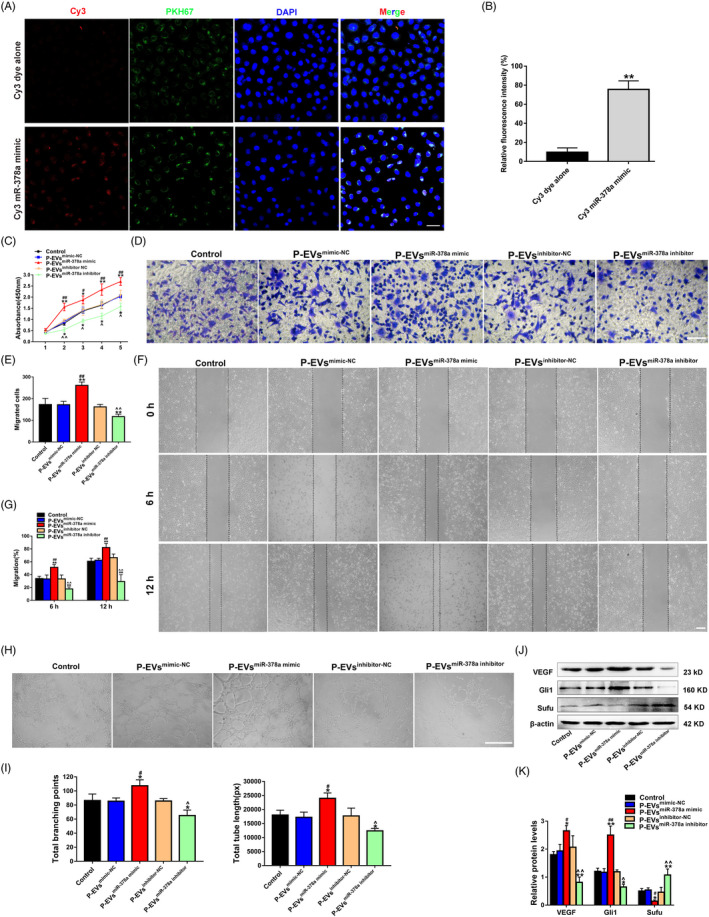
FIGURE 5.

P‐EV‐mediated transmission of miR‐378a promotes EC angiogenesis through activating Hedgehog/Gli1 signalling. (A) The presence of Cy3 fluorescence and PKH67 lipid dye in ECs after adding PKH67 (green) labelled P‐EVs that modified with Cy3‐labelled miR‐378a mimic (red) (the bottom panels). ECs incubated with Cy3 dye alone (not conjugated to miR‐378a mimic) were used as the control (the top panels). Nuclei were stained with DAPI (blue) for counterstaining (scale bar, 50 μm). (B) Quantitative analysis of the fluorescence intensity in A (n = 3, **P <.01 vs. Cy3 dye along). (C) The proliferation of ECs exposed to P‐EVsmimic‐NC, P‐EVsmiR‐378a mimic, P‐EVsinhibitor‐NC, P‐EVsmiR‐378a inhibitor and an equal volume of PBS was tested by CCK‐8 assay (n = 3). (D) The migration of ECs stimulated by P‐EVsmimic‐NC, P‐EVsmiR‐378a mimic, P‐EVsinhibitor‐NC, P‐EVsmiR‐378a inhibitor and PBS was detected by transwell assay (scale bar, 100 μm). (E) Quantitative analysis of the migrated cells in D (n = 5). (F) Representative images of the scratch wound assay in ECs treated with P‐EVsmimic‐NC, P‐EVsmiR‐378a mimic, P‐EVsinhibitor‐NC, P‐EVsmiR‐378a inhibitor and PBS (scale bar, 200 μm). (G) Quantitative analysis of the migration rates in F (n = 3). (H) Representative images of the tube formation assay in ECs treated with P‐EVsmimic‐NC, P‐EVsmiR‐378a mimic, P‐EVsinhibitor‐NC, P‐EVsmiR‐378a inhibitor and PBS (scale bar, 200 μm). (I) Quantitative analyses of the total branching points and total tube length in H (n = 3). (J) Protein levels of VEGF, Gli1 and Sufu in ECs detected by Western blot. (K) Quantitative analysis of the relative protein expression in J (n = 3). *P <.05, **P <.01 vs. the Control group; # P <.05, ## P <.01 vs. the P‐EVsmimic‐NC group; ^ P <.05, ^^ P <.01 vs. the P‐EVsinhibitor‐NC group
