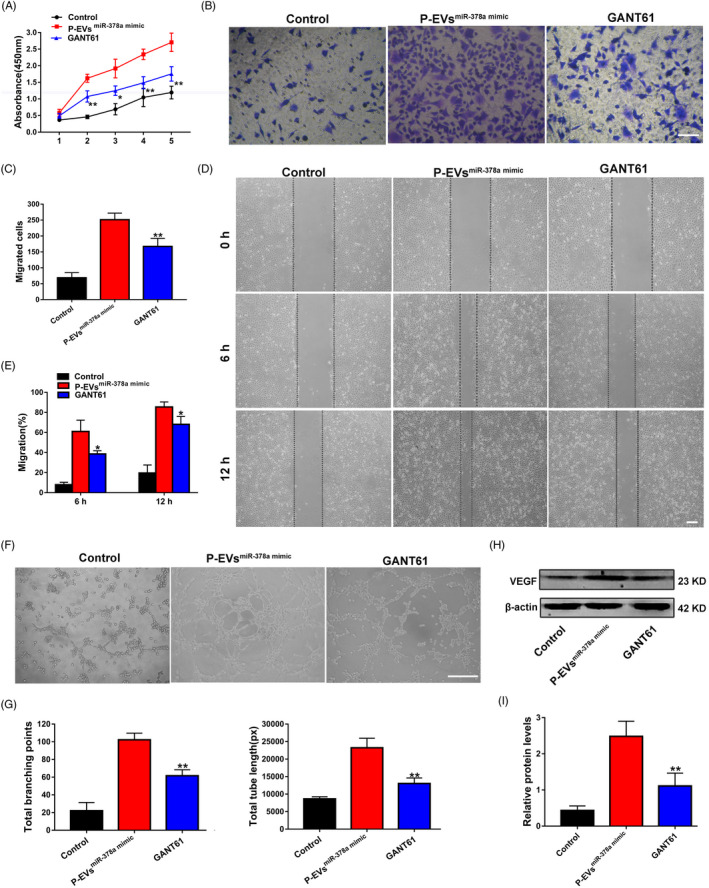
FIGURE 6.

Blockage of Hedgehog/Gli1 signalling reverses the enhanced proliferation, migration and angiogenesis of ECs induced by P‐EVsmiR‐378a mimic. (A) The proliferation of ECs treated with PBS, P‐EVsmiR‐378a mimic, and P‐EVsmiR‐378a mimic with GANT61 was tested by CCK‐8 assay. (B)The migration of ECs treated with PBS, P‐EVsmiR‐378a mimic and P‐EVsmiR‐378a mimic with GANT61 was detected by transwell assay (scale bar, 100 μm). (C) Quantitative analysis of the migrated cells in B (n = 5). (D) Representative images of the scratch wound assay in ECs treated with PBS, P‐EVsmiR‐378a mimic, and P‐EVsmiR‐378a mimic with GANT61 (scale bar, 200 μm). (E) Quantitative analysis of the migration rates in D. (F) Representative images of the tube formation assay in ECs (scale bar, 200 μm). (G) Quantitative analyses of the total branching points and total tube length in F (n = 3). (H) Protein levels of VEGF in ECs detected by Western blot. (I) Quantitative analysis of the relative protein expression in H (n = 3). *P <.05, **P <.01 vs. the P‐EVsmiR‐378a mimic group
