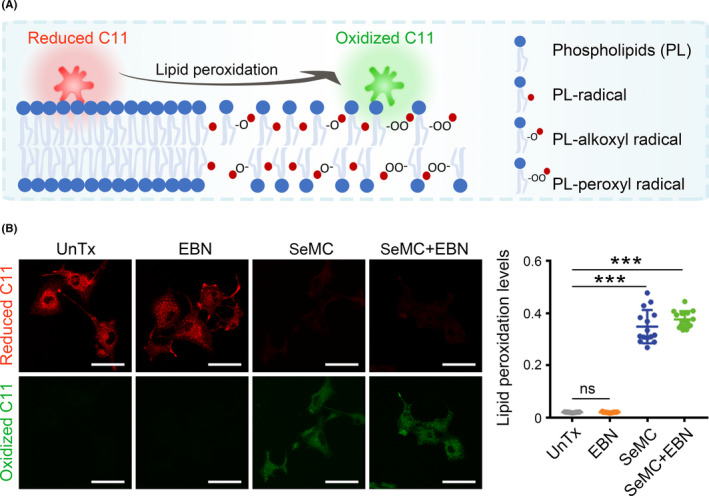
FIGURE 3.

SeMC induces lipid peroxidation. (A) A diagram for the detection of lipid peroxides by BODIPY C11. (B) Left panels: fluorescent images showing reduced form (red) and oxidized form (green) of BODIPY C11 in A549 cells after exposure to 200 μM SeMC, 0.2 μg/mL EBN, or their combination. Scale bars: 50 μm. Right panel: Relative lipid peroxidation levels represented as the ratio of oxidized to reduce BODIPY‐C11. Data are represented as mean ±SD (n = 15). ***P < .001, ns means not significant
