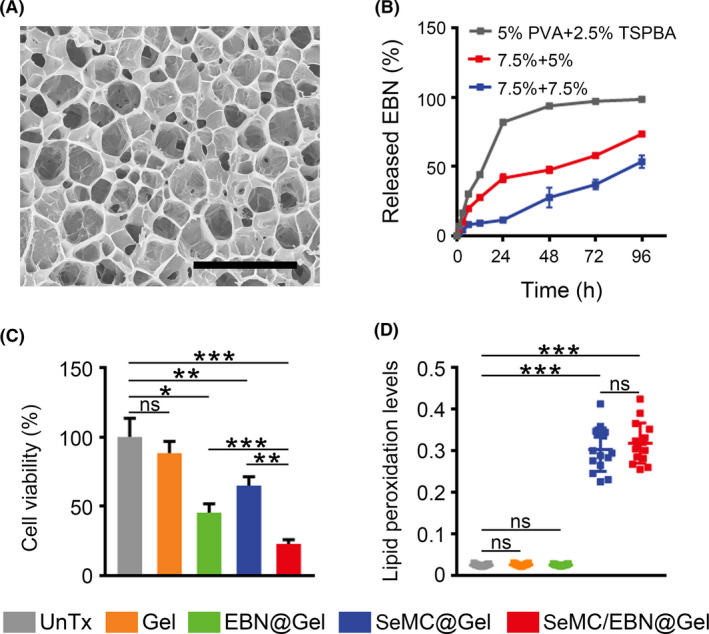
FIGURE 4.

Characterization of drug‐loaded hydrogel. (A) Cryo‐SEM imaging of the hydrogel composed of 7.5 wt% PVA matrix and 5 wt% TSPBA linker. Scale bar: 5 μm. (B) Disassembly kinetics of EBN@Gel with different PVA and TSPBA concentrations in the presence of 0.5 mM H2O2. Data are represented as mean ±SD (n = 3). (C) Viabilities of A549 cells incubated with the supernatant from Gel, SeMC@Gel, EBN@Gel or SeMC/EBN@Gel. The concentrations of SeMC and EBN in the supernatant were 200 μM and 0.2 μg/mL, respectively. Data are represented as mean ±SD (n = 3). (D) Relative lipid peroxidation levels in A549 cells treated with the supernatant from Gel, SeMC@Gel, EBN@Gel or SeMC/EBN@Gel are represented as the ratio of oxidized to reduce BODIPY‐C11. The concentrations of SeMC and EBN in the supernatant were 200 μM and 0.2 μg/mL, respectively. Data are represented as mean ±SD (n = 15). *P < .05, **P < .01, ***P < .001, ns means not significant
