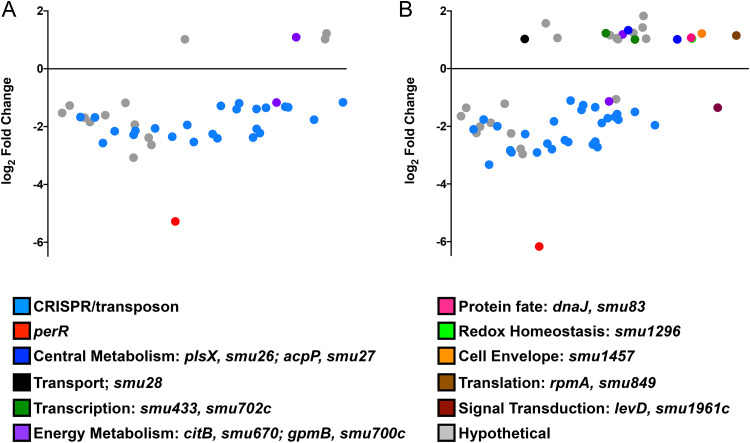
FIG 4.
Dot plot of genes differentially expressed in UAΔperR compared to those in UA159 as determined by Degust (http://degust.erc.monash.edu/) under control (A) or H2O2 stress (B) conditions. The y axis indicates the log2 fold change in expression, while the x axis indicates the average expression level of each gene compared to that of all other genes. The details of the expression trends are shown in Table S2 in the supplemental material.

