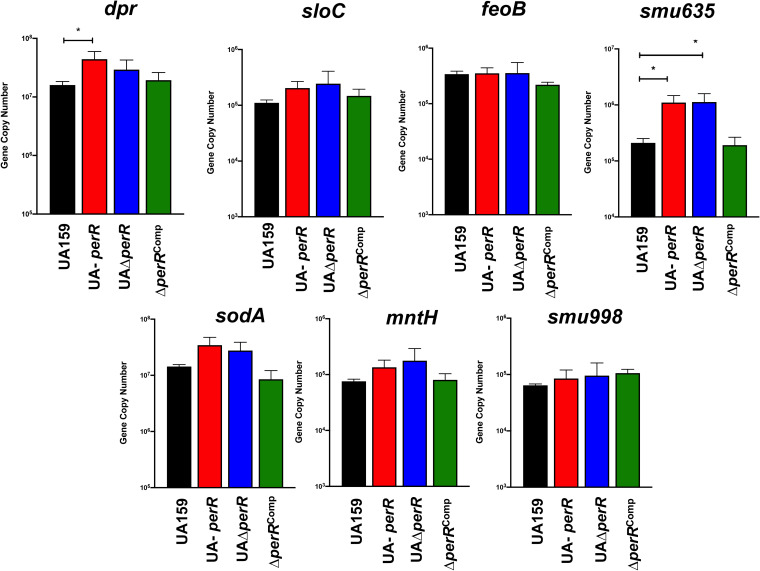
FIG 5.
RT-qPCR analysis of genes with putative PerR-binding motifs reveals a trend of PerR transcriptional repression. Bars represent the gene copy number and represent averages and standard deviations (SDs) from three replicate samples. ANOVA was performed to verify significance of the data; expression levels of each gene were compared to those of UA159. *, P ≤ 0.03.

