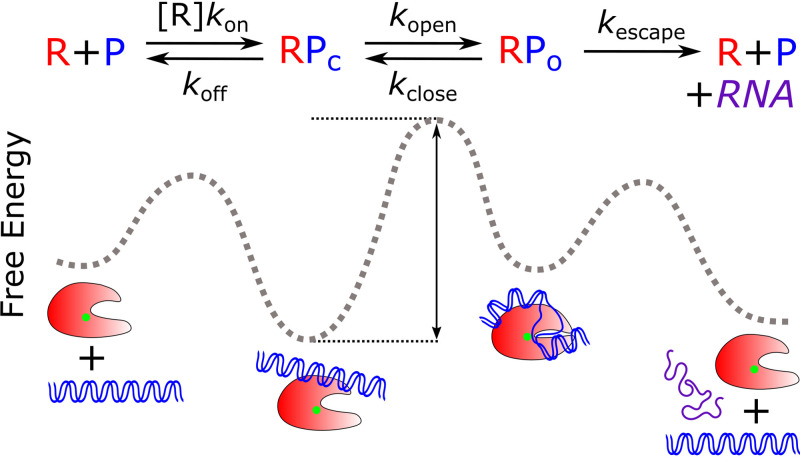
FIG 2.
Kinetic scheme of initiation used for calculation of free energy landscapes. In this kinetic model, RNAP (R; red) and promoter DNA (P; blue) form a closed promoter complex (RPc) with a concentration-dependent association rate (kon) and dissociate with rate koff. The equilibrium between the open promoter complex (RPo) and RPc is depicted by the composite forward and reverse isomerization rates, kopen and kclose, respectively. RPo formation involves the wrapping of upstream DNA and loading into the RNAP cleft, coupled with RNAP conformational changes. The DNA is opened around the TSS, positioned near the active site (green dot). Promoter escape is modeled as an irreversible transition by rate kescape, leading to RNAP dissociation from the promoter template and the generation of one full-length RNA transcript. These individual rate constants are used to calculate an overall initiation rate, which we use as a readout of the steady-state rate of RNA production. The stability of and transitions between these initiation intermediates can be depicted on a free energy reaction coordinate diagram. Here, the height of the barrier between an intermediate’s energy well and its transition state (black arrow) determines the interconversion rates, and the depth of an intermediate’s well determines its stability.

