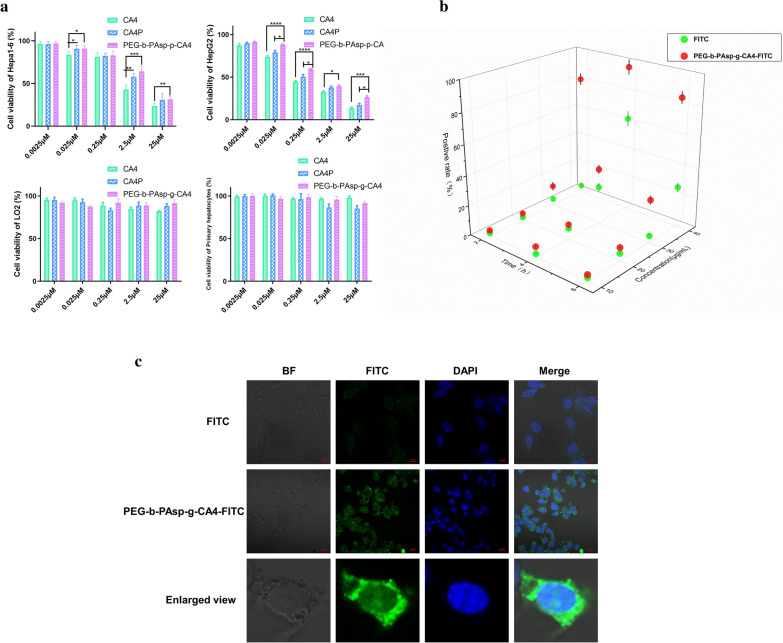
Fig. 2.
The cytotoxicity and uptake of the CA4-NPs. a Cytotoxicity of CA4, CA4P, PEG-b-PAsp-g-CA4 to Hepa1-6, HepG2, primary hepatocytes, LO2; b Fluorescence intensity of positive Hepa1-6 cells mixed with FITC and PEG-b-PAsp-g-CA4-FITC under different condition (Concentration of FITC and PEG-b-PAsp-g-CA4-FITC (on the FITC basis) varied from 10 to 40 μg mL−1 and incubated time was 2, 4, 6 h.). Cellular uptake was analyzed by fluorescence-activated cell sorting (FACS); c Confocal images of Hepa1-6 cells after a 4 h incubation with 40 μg FITC mL−1 and PEG-b-PAsp-g-CA4-FITC (on the FITC basis). Scale bar: 20 µm. Significance between each pair of groups was calculated using Student’s t-test. *p < 0.05, **p < 0.01, ***p < 0.001, ****p < 0.0001. The values are presented as the mean ± SD, n = 6

