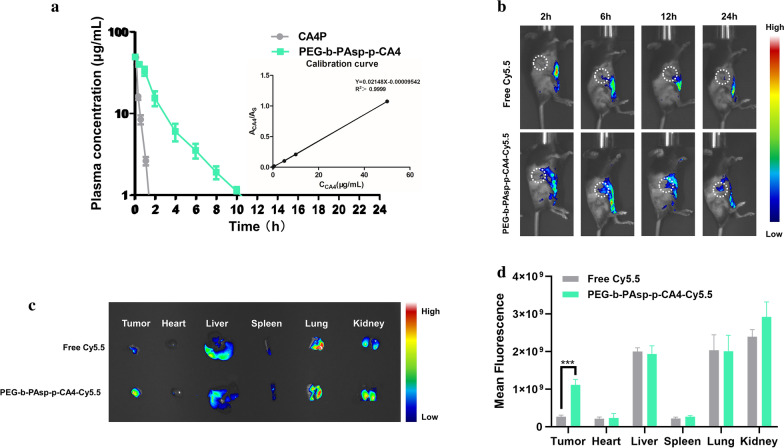
Fig. 3.
Pharmacokinetics and biodistribution of CA4-NPs. a Pharmacokinetics of CA4P and PEG-b-PAsp-g-CA4; b In vivo fluorescence images of Hepa1-6 tumor-bearing mice taken at different time points intravenously administrated with Cy5.5 and PEG-b-PAsp-g-CA4-Cy5.5; c Ex vivo fluorescence images of the major organs (heart, liver, spleen, lungs, and kidneys) and tumors at 24 h intravenous administration; d Quantitative analysis of ex vivo Cy5.5 fluorescence intensity of the organs and tumor. Significance between each pair of groups was calculated using Student’s t-test. *p < 0.05, **p < 0.01, ***p < 0.001, ****p < 0.0001. The values are presented as the mean ± SD, n = 3

