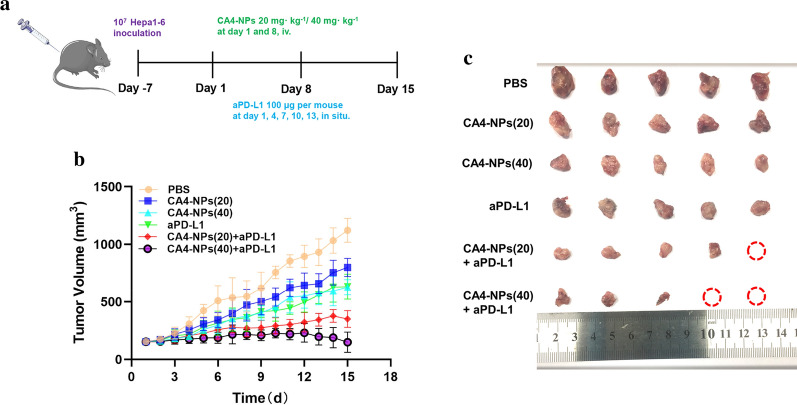
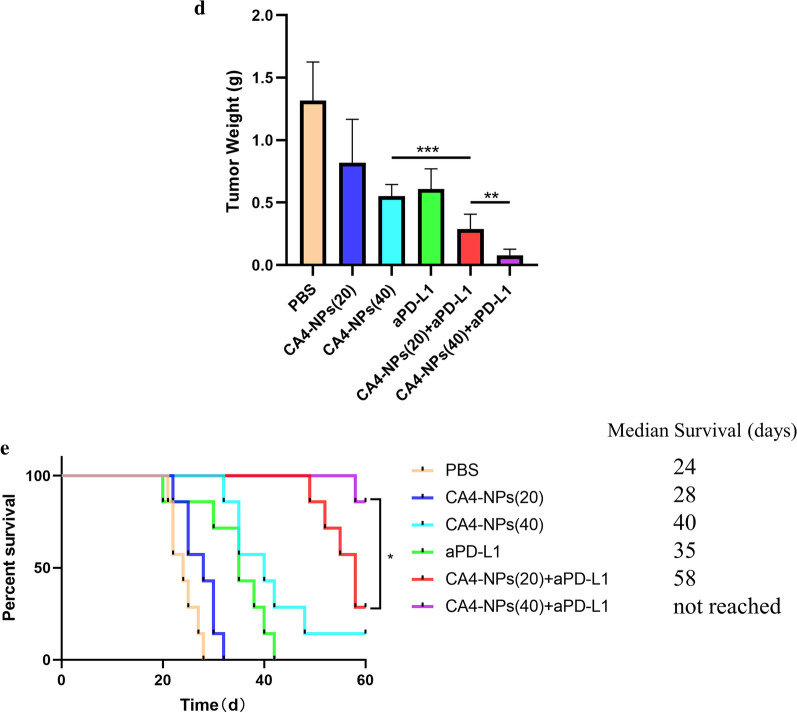
Fig. 5.
Co-administration of anti-tumor efficacy In vivo. a Treatment scheme of subcutaneous Hepa1-6 tumors with CA4-NPs and aPD-L1; b Tumor volume growth curves following different treatments; c Representative images of the excised tumors after different treatments; shown are PBS-treated mice and mice receiving after injection with CA4-NPs (20 mg kg−1), CA4-NPs (40 mg kg−1), aPD-L1, CA4-NPs (20 mg kg−1) + aPD-L1, CA4-NPs (40 mg kg−1) + aPD-L1; d Tumor weights from the different groups on day 15; e The survival percentages of the tumor-bearing C57BL/6 mice (n = 7 biologically independent samples). Significance between each pair of groups was calculated using Student’s t-test. *p < 0.05, **p < 0.01, ***p < 0.001, ****p < 0.0001. The values are presented as the mean ± SD, n = 10


