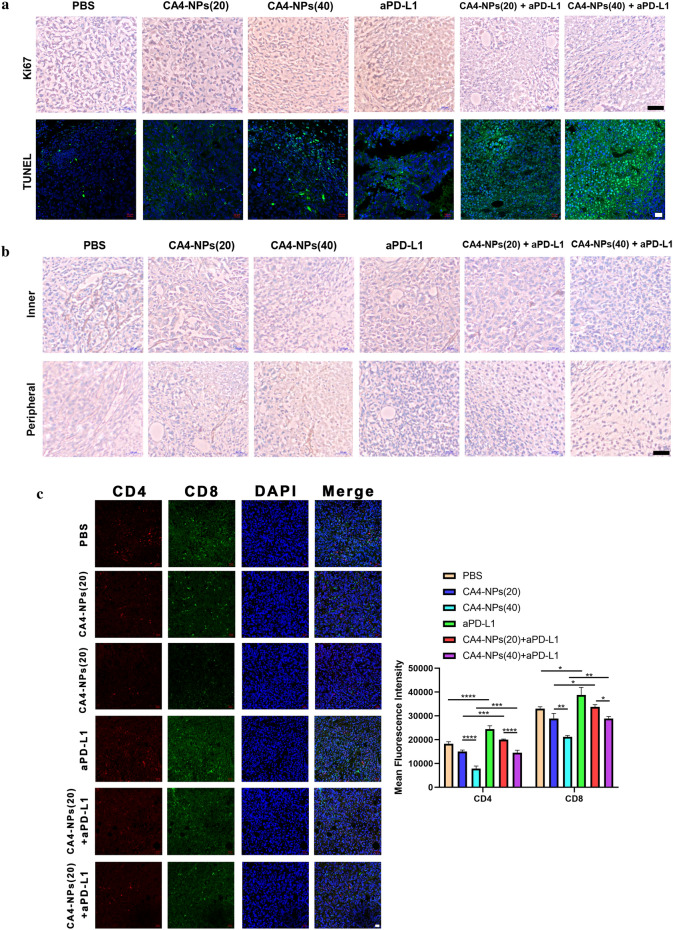
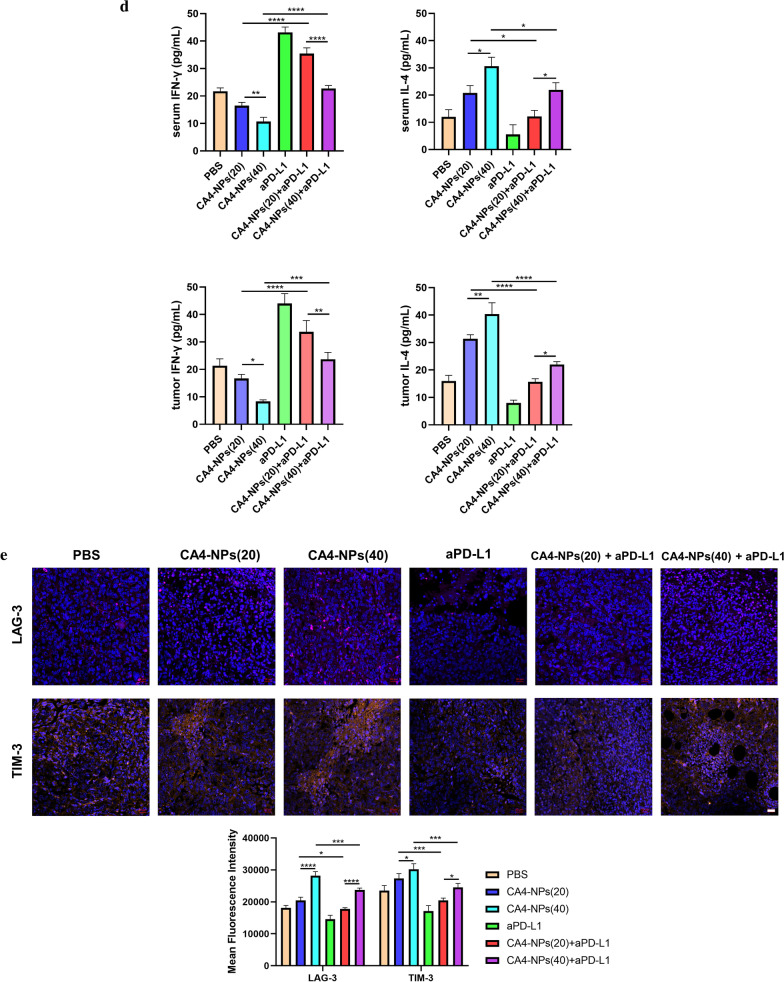
Fig. 6.
a Ki67 and TUNEL staining of tumor tissues after different treatments; b Immunohistochemical reactivity for blood vessel endothelial cell marker CD31 in subcutaneous Hepa1-6 bearing mice; c Double-color immunofluorescence staining for CD4 (Red) and CD8(Green) expression of tumor tissues, and quantitative immunofluorescence analysis; d The secretions of cytokines in serum and tumor site were measured by ELISA (levels of IFN-γ and IL-4); e Immunofluorescence staining for LAG-3 and TIM-3 expression of tumor tissues, and quantitative immunofluorescence analysis. Black scale bar = 100 μm and white scale bar = 20 μm. Significance between each pair of groups was calculated using Student’s t-test. *p < 0.05, **p < 0.01, ***p < 0.001, ****p < 0.0001. The values are presented as the mean ± SD, n = 3


