FIGURE 4.

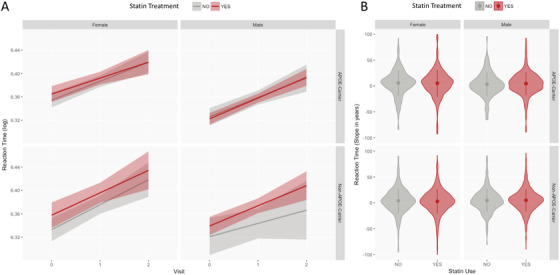
Comparison of statin users (red) and non‐users (gray) in the different population strata. For each of the four strata, the figure reports Reaction Time (RT) log‐transformed scores in time, and the RT Slope.yrs in the observation period

Comparison of statin users (red) and non‐users (gray) in the different population strata. For each of the four strata, the figure reports Reaction Time (RT) log‐transformed scores in time, and the RT Slope.yrs in the observation period