
FIGURE 1.
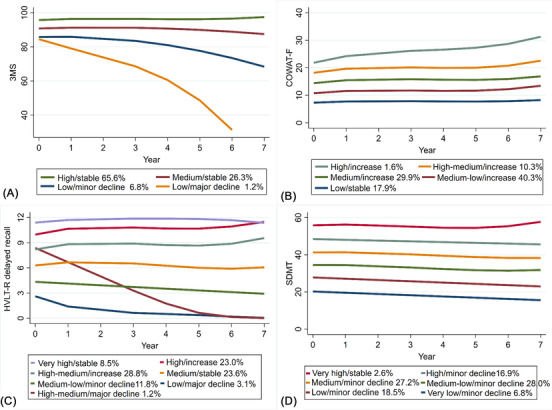
Trajectory plots of individual cognitive tests (A) 3MS (n = 18,016), (B) COWAT‐F (n = 17,971), (C) HVLT‐R delayed recall (n = 17,837), (D) SDMT (n = 17,883). 3MS, modified Mini‐Mental State Examination; COWAT‐F, Controlled Oral Word Association Test‐F; HVLT‐R, Hopkins Verbal Learning Test–Revised (delayed recall); SDMT, Symbol Digit Modalities Test. Note: (1) The x‐axis denotes the year of cognitive assessments conducted at baseline as well as 1, 3, 4, 5, 6, and 7 years of follow‐up. The y‐axis denotes the raw scores of the cognitive tests. (2) The percentages refer to the proportions of participants assigned into the corresponding classes