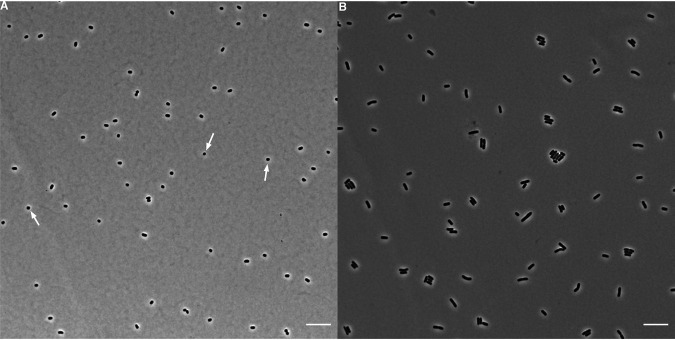
FIG 11.
Representative micrographs of cells from 2,000-generation (A) and 50,000-generation (B) clones of the Ara+5 population. Phase-contrast images were taken on an inverted microscope at a magnification of ×100. Scale bars are 10 μm. Arrows point to examples of nearly spherical cells in the earlier sample, which are not seen in the later one.

